
Oxford Industries, Inc. (NYSE:OXM) Stock's Been Sliding But Fundamentals Look Decent: Will The Market Correct The Share Price In The Future?
Oxford Industries, Inc. (NYSE:OXM) Stock's Been Sliding But Fundamentals Look Decent: Will The Market Correct The Share Price In The Future?
 Return on Equity = Net Profit (from continuing operations) ÷ Shareholders' Equity
 With its stock down 15% over the past three months, it is easy to disregard Oxford Industries (NYSE:OXM). However, the company's fundamentals look pretty decent, and long-term financials are usually aligned with future market price movements. Particularly, we will be paying attention to Oxford Industries' ROE today.
股票在過去三個月下跌了15%,很容易忽視牛津工業(紐交所:OXM)。然而,該公司的基本面看起來相當不錯,長期財務狀況通常與未來市場價格走勢保持一致。特別是,我們今天將關注牛津工業的roe。
ROE or return on equity is a useful tool to assess how effectively a company can generate returns on the investment it received from its shareholders. In other words, it is a profitability ratio which measures the rate of return on the capital provided by the company's shareholders.
roe,即淨資產收益率,是一種評估公司如何有效地從股東手中獲取投資回報的有用工具。換句話說,它是一種盈利能力比率,衡量公司股東提供的資本的回報率。
How To Calculate Return On Equity?
如何計算股東權益報酬率?
The formula for return on equity is:
權益回報率的計算公式是:
Return on Equity = Net Profit (from continuing operations) ÷ Shareholders' Equity
淨資產收益率 = 淨利潤(從持續經營中獲得)÷ 股東權益
So, based on the above formula, the ROE for Oxford Industries is:
因此,根據上述公式,牛津工業的ROE爲:
4.8% = US$30m ÷ US$622m (Based on the trailing twelve months to August 2024).
4.8%= 3000萬美元 ÷ 62200萬美元(基於截至2024年8月的過去十二個月)。
The 'return' is the income the business earned over the last year. Another way to think of that is that for every $1 worth of equity, the company was able to earn $0.05 in profit.
「回報」是企業過去一年賺取的收入。另一種理解方式是,對於每1美元的淨資產,公司能夠賺取0.05美元的利潤。
What Is The Relationship Between ROE And Earnings Growth?
ROE與盈利增長之間的關係是什麼?
Thus far, we have learned that ROE measures how efficiently a company is generating its profits. Based on how much of its profits the company chooses to reinvest or "retain", we are then able to evaluate a company's future ability to generate profits. Generally speaking, other things being equal, firms with a high return on equity and profit retention, have a higher growth rate than firms that don't share these attributes.
到目前爲止,我們已經知道roe衡量公司生成利潤的效率。根據公司選擇再投資或「保留」的利潤的多少,我們能夠評估公司未來生成利潤的能力。一般而言,在其他條件相等的情況下,roe和盈利保留較高的公司,比沒有這些屬性的公司增長率更高。
A Side By Side comparison of Oxford Industries' Earnings Growth And 4.8% ROE
牛津工業的盈利增長和4.8%的roe的並列比較
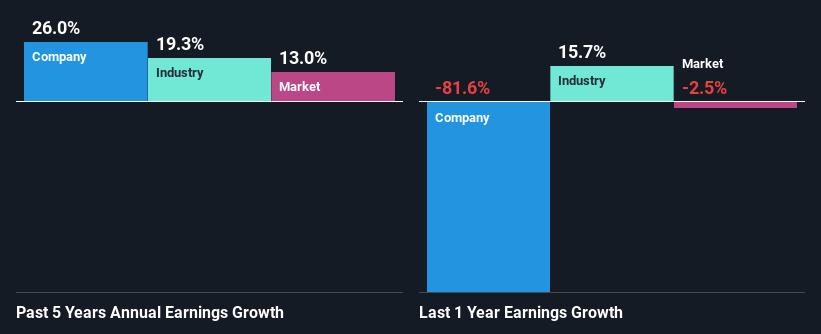
At first glance, Oxford Industries' ROE doesn't look very promising. We then compared the company's ROE to the broader industry and were disappointed to see that the ROE is lower than the industry average of 13%. In spite of this, Oxford Industries was able to grow its net income considerably, at a rate of 26% in the last five years. We reckon that there could be other factors at play here. For example, it is possible that the company's management has made some good strategic decisions, or that the company has a low payout ratio.
乍看之下,牛津工業的roe看起來並不樂觀。然後我們將公司的roe與更廣泛的行業進行了比較,令人失望的是,roe低於行業平均13%。儘管如此,牛津工業的淨利潤增長幅度在過去五年達到26%。我們認爲這裏可能存在其他因素。例如,公司的管理團隊可能做出了一些明智的戰略決策,或者公司的支付比率較低。
Next, on comparing with the industry net income growth, we found that Oxford Industries' growth is quite high when compared to the industry average growth of 19% in the same period, which is great to see.
接下來,通過與行業淨利潤增長進行比較,我們發現牛津工業的增長比同期行業平均增長19%要高很多,這是很好的跡象。
The basis for attaching value to a company is, to a great extent, tied to its earnings growth. The investor should try to establish if the expected growth or decline in earnings, whichever the case may be, is priced in. By doing so, they will have an idea if the stock is headed into clear blue waters or if swampy waters await. Is OXM fairly valued? This infographic on the company's intrinsic value has everything you need to know.
評估一家公司的價值很大程度上取決於其盈利增長。投資者應該嘗試確定市場是否已經反映了盈利增長或下降的預期。通過這樣做,他們將能夠了解股票是走向清澈的藍水,還是即將迎來沼澤般的困境。OXm估值合理嗎?這份關於公司內在價值的信息圖表涵蓋了您需要了解的一切。
Is Oxford Industries Efficiently Re-investing Its Profits?
牛津工業有效地重新投資其利潤嗎?
Oxford Industries' three-year median payout ratio to shareholders is 22%, which is quite low. This implies that the company is retaining 78% of its profits. So it looks like Oxford Industries is reinvesting profits heavily to grow its business, which shows in its earnings growth.
牛津工業向股東支付的三年中位分紅比率爲22%,非常低。這意味着該公司將其利潤的78%留存下來。因此,看起來牛津工業正在大量重新投資利潤以促進業務增長,這體現在其盈利增長上。
Besides, Oxford Industries has been paying dividends for at least ten years or more. This shows that the company is committed to sharing profits with its shareholders. Looking at the current analyst consensus data, we can see that the company's future payout ratio is expected to rise to 45% over the next three years. Still, forecasts suggest that Oxford Industries' future ROE will rise to 18% even though the the company's payout ratio is expected to rise. We presume that there could some other characteristics of the business that could be driving the anticipated growth in the company's ROE.
此外,牛津工業至少已連續十年分紅。這表明公司致力於與股東分享利潤。根據當前分析師一致數據,我們可以看到公司未來分紅比率預計將在未來三年內上升至45%。儘管預測表明,牛津工業未來ROE將在公司的預期分紅比率上升的情況下上升至18%。我們推測可能是業務的其他特徵正在推動公司ROE預期增長。
Summary
總的來說,我們對偉明環保的表現非常滿意。具體而言,我們喜歡公司以高回報率再投資了其利潤的很大一部分。當然,這導致公司的收益大幅增長。但是,最新的行業分析師預測表明,該公司的收益預計將加速增長。
Overall, we feel that Oxford Industries certainly does have some positive factors to consider. Even in spite of the low rate of return, the company has posted impressive earnings growth as a result of reinvesting heavily into its business. With that said, the latest industry analyst forecasts reveal that the company's earnings are expected to accelerate. To know more about the latest analysts predictions for the company, check out this visualization of analyst forecasts for the company.
總的來說,我們認爲牛津工業確實有一些積極因素需要考慮。儘管回報率較低,但由於大量再投資業務,公司的收入增長令人印象深刻。也正因如此,最新的行業分析師預測顯示,公司的收入預計將加速增長。要了解更多關於該公司的最新分析師預測,請查看該可視化分析師預測。
Have feedback on this article? Concerned about the content? Get in touch with us directly. Alternatively, email editorial-team (at) simplywallst.com.
This article by Simply Wall St is general in nature. We provide commentary based on historical data and analyst forecasts only using an unbiased methodology and our articles are not intended to be financial advice. It does not constitute a recommendation to buy or sell any stock, and does not take account of your objectives, or your financial situation. We aim to bring you long-term focused analysis driven by fundamental data. Note that our analysis may not factor in the latest price-sensitive company announcements or qualitative material. Simply Wall St has no position in any stocks mentioned.
對本文有任何反饋?對內容有任何疑慮?請直接與我們聯繫。或者,發送電子郵件至editorial-team@simplywallst.com。
這篇文章是Simply Wall St的一般性文章。我們根據歷史數據和分析師預測提供評論,只使用公正的方法論,我們的文章並不意味着提供任何金融建議。文章不構成買賣任何股票的建議,也不考慮您的目標或您的財務狀況。我們的目標是帶給您基本數據驅動的長期關注分析。請注意,我們的分析可能不考慮最新的價格敏感公司公告或定性材料。Simply Wall St沒有任何股票頭寸。
譯文內容由第三人軟體翻譯。