
Does Aptiv (NYSE:APTV) Have A Healthy Balance Sheet?
Does Aptiv (NYSE:APTV) Have A Healthy Balance Sheet?
 Zooming in on the latest balance sheet data, we can see that Aptiv had liabilities of US$5.91b due within 12 months and liabilities of US$7.07b due beyond that. Offsetting these obligations, it had cash of US$2.16b as well as receivables valued at US$4.11b due within 12 months. So its liabilities outweigh the sum of its cash and (near-term) receivables by US$6.71b.
 Warren Buffett famously said, 'Volatility is far from synonymous with risk.' So it might be obvious that you need to consider debt, when you think about how risky any given stock is, because too much debt can sink a company. We can see that Aptiv PLC (NYSE:APTV) does use debt in its business. But the more important question is: how much risk is that debt creating?
禾倫·巴菲特曾經說過:「波動性與風險遠非同義詞。」因此,當你考慮任何特定股票的風險時,需要考慮債務,因爲過多的債務可能會拖垮一家公司。我們可以看到 aptiv plc (紐交所: APTV) 在業務中使用了債務。但更重要的問題是:這筆債務產生了多少風險?
When Is Debt A Problem?
什麼時候負債才是一個問題?
Debt assists a business until the business has trouble paying it off, either with new capital or with free cash flow. Part and parcel of capitalism is the process of 'creative destruction' where failed businesses are mercilessly liquidated by their bankers. However, a more common (but still painful) scenario is that it has to raise new equity capital at a low price, thus permanently diluting shareholders. Having said that, the most common situation is where a company manages its debt reasonably well - and to its own advantage. The first step when considering a company's debt levels is to consider its cash and debt together.
債務對企業有所幫助,直到企業因新資本或自由現金流難以償還。資本主義的重要特徵之一是「創造性破壞」過程,即企業失敗後將被銀行家無情地清算。然而,更常見(但仍然痛苦的)情況是,企業必須以低價募集新股權資本,從而永久地稀釋股東權益。儘管如此,最常見的情況是企業合理利用其債務,並使之爲其所用。考慮一家公司的債務水平時的第一步是將其現金和債務考慮在一起。
How Much Debt Does Aptiv Carry?
aptiv負債多少?
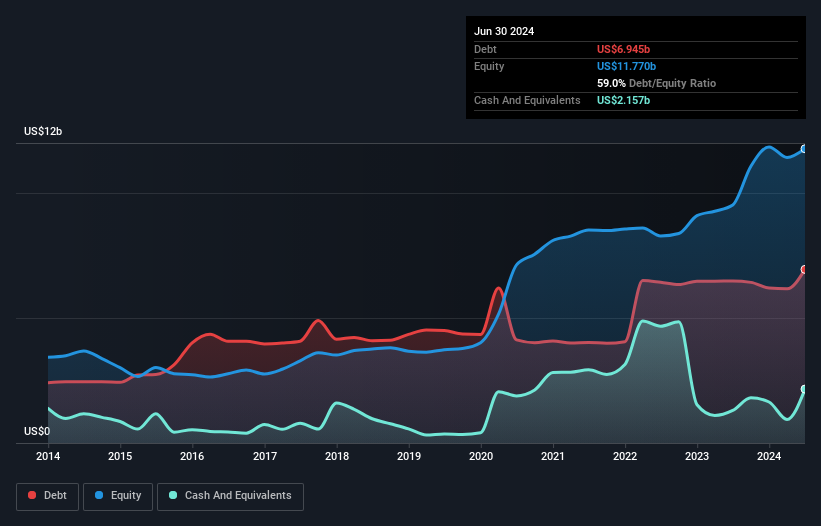
The image below, which you can click on for greater detail, shows that at June 2024 Aptiv had debt of US$6.95b, up from US$6.48b in one year. However, because it has a cash reserve of US$2.16b, its net debt is less, at about US$4.79b.
下面的圖片,您可以點擊查看更多詳細信息,顯示截至2024年6月,aptiv的債務爲69.5億美元,比一年前的64.8億美元增加。然而,由於其21.6億美元的現金儲備,淨債務較少,約爲47.9億美元。
How Healthy Is Aptiv's Balance Sheet?
aptiv plc的資產負債表健康嗎?
Zooming in on the latest balance sheet data, we can see that Aptiv had liabilities of US$5.91b due within 12 months and liabilities of US$7.07b due beyond that. Offsetting these obligations, it had cash of US$2.16b as well as receivables valued at US$4.11b due within 12 months. So its liabilities outweigh the sum of its cash and (near-term) receivables by US$6.71b.
深入研究最新的資產負債表數據,我們發現aptiv plc在12個月內到期的負債爲591億美元,在此之後到期的負債爲707億美元。抵消這些負債的是216億美元的現金以及411億美元的在12個月內到期的應收賬款。因此,其負債超過了現金和(短期)應收賬款總和671億美元。
Aptiv has a very large market capitalization of US$19.7b, so it could very likely raise cash to ameliorate its balance sheet, if the need arose. But we definitely want to keep our eyes open to indications that its debt is bringing too much risk.
aptiv plc的市值非常大,達到197億美元,因此在有需要時很可能籌集現金以改善其資產負債表。但我們絕對要留心其債務是否帶來過多風險。
We use two main ratios to inform us about debt levels relative to earnings. The first is net debt divided by earnings before interest, tax, depreciation, and amortization (EBITDA), while the second is how many times its earnings before interest and tax (EBIT) covers its interest expense (or its interest cover, for short). Thus we consider debt relative to earnings both with and without depreciation and amortization expenses.
我們使用兩個主要的比率來告訴我們相對於收益的債務水平。第一個是淨債務除以利息、稅、折舊和攤銷前利潤(EBITDA),而第二個是其利潤前利息和稅(EBIT)覆蓋其利息費用的次數(或其利息覆蓋率,簡稱)。因此,我們考慮與折舊和攤銷費用相關的盈利以及沒有相關費用的盈利相對於債務水平。
Aptiv's net debt to EBITDA ratio of about 1.6 suggests only moderate use of debt. And its commanding EBIT of 11.7 times its interest expense, implies the debt load is as light as a peacock feather. Also good is that Aptiv grew its EBIT at 16% over the last year, further increasing its ability to manage debt. When analysing debt levels, the balance sheet is the obvious place to start. But it is future earnings, more than anything, that will determine Aptiv's ability to maintain a healthy balance sheet going forward. So if you're focused on the future you can check out this free report showing analyst profit forecasts.
aptiv plc的淨債務與EBITDA比率約爲1.6,表明只是適度利用債務。其11.7倍利息支出的EBIT則意味着債務負擔輕如孔雀羽毛。此外,aptiv plc過去一年將其EBIT增長了16%,進一步增加了管理債務的能力。在分析債務水平時,資產負債表顯然是開始的地方。但決定aptiv plc未來是否能保持健康資產負債表的能力,更多取決於未來收入。因此,如果你關注未來,可以查看這份顯示分析師盈利預測的免費報告。
But our final consideration is also important, because a company cannot pay debt with paper profits; it needs cold hard cash. So we clearly need to look at whether that EBIT is leading to corresponding free cash flow. In the last three years, Aptiv's free cash flow amounted to 45% of its EBIT, less than we'd expect. That weak cash conversion makes it more difficult to handle indebtedness.
但我們最終考慮的也很重要,因爲企業無法用紙面利潤償還債務;它需要現金。因此,我們明顯需要看看這個EBIT是否導致相應的自由現金流。在過去三年中,aptiv plc的自由現金流佔其EBIT的45%,低於預期。這種低的現金轉化率使處理負債更加困難。
Our View
我們的觀點
Happily, Aptiv's impressive interest cover implies it has the upper hand on its debt. And that's just the beginning of the good news since its EBIT growth rate is also very heartening. All these things considered, it appears that Aptiv can comfortably handle its current debt levels. Of course, while this leverage can enhance returns on equity, it does bring more risk, so it's worth keeping an eye on this one. The balance sheet is clearly the area to focus on when you are analysing debt. But ultimately, every company can contain risks that exist outside of the balance sheet. Case in point: We've spotted 2 warning signs for Aptiv you should be aware of, and 1 of them doesn't sit too well with us.
令人欣喜的是,aptiv plc令人印象深刻的利息覆蓋率意味着它在債務方面擁有優勢。而這只是好消息的開始,因爲它的EBIT增長率也非常令人振奮。考慮到所有這些因素,看起來aptiv plc可以輕鬆處理其當前的債務水平。當然,雖然這種槓桿可以提高股本回報率,但也會帶來更多風險,因此值得關注。當你分析債務時,資產負債表顯然是需要重點關注的領域。但最終,每家公司都可能存在資產負債表之外的風險。舉例來說:我們發現aptiv plc存在2個警示信號,你應該注意,其中1個令我們有些不安。
At the end of the day, it's often better to focus on companies that are free from net debt. You can access our special list of such companies (all with a track record of profit growth). It's free.
歸根結底,專注於沒有淨債務的公司往往更好。您可以訪問我們的特別列表,其中包括所有表現出盈利增長軌跡的公司。這是免費的。
Have feedback on this article? Concerned about the content? Get in touch with us directly. Alternatively, email editorial-team (at) simplywallst.com.
This article by Simply Wall St is general in nature. We provide commentary based on historical data and analyst forecasts only using an unbiased methodology and our articles are not intended to be financial advice. It does not constitute a recommendation to buy or sell any stock, and does not take account of your objectives, or your financial situation. We aim to bring you long-term focused analysis driven by fundamental data. Note that our analysis may not factor in the latest price-sensitive company announcements or qualitative material. Simply Wall St has no position in any stocks mentioned.
對本文有任何反饋?對內容有任何疑慮?請直接與我們聯繫。或者,發送電子郵件至editorial-team@simplywallst.com。
這篇文章是Simply Wall St的一般性文章。我們根據歷史數據和分析師預測提供評論,只使用公正的方法論,我們的文章並不意味着提供任何金融建議。文章不構成買賣任何股票的建議,也不考慮您的目標或您的財務狀況。我們的目標是帶給您基本數據驅動的長期關注分析。請注意,我們的分析可能不考慮最新的價格敏感公司公告或定性材料。Simply Wall St沒有任何股票頭寸。
譯文內容由第三人軟體翻譯。