
Freeport-McMoRan's (NYSE:FCX) Five-year Earnings Growth Trails the 43% YoY Shareholder Returns
Freeport-McMoRan's (NYSE:FCX) Five-year Earnings Growth Trails the 43% YoY Shareholder Returns
 Over half a decade, Freeport-McMoRan managed to grow its earnings per share at 14% a year. This EPS growth is lower than the 42% average annual increase in the share price. So it's fair to assume the market has a higher opinion of the business than it did five years ago. That's not necessarily surprising considering the five-year track record of earnings growth.
 Buying shares in the best businesses can build meaningful wealth for you and your family. And highest quality companies can see their share prices grow by huge amounts. Just think about the savvy investors who held Freeport-McMoRan Inc. (NYSE:FCX) shares for the last five years, while they gained 470%. If that doesn't get you thinking about long term investing, we don't know what will. And in the last month, the share price has gained 13%.
購買最佳企業股票可以爲您和家人創造可觀財富。而最優質的公司股價有可能會增長很多。想想那些聰明的投資者吧,他們在過去五年持有美洲自由港公司(NYSE:FCX)的股票,股價增長了470%。如果這不能讓您考慮長期投資,那就不知道還有什麼能。而在過去一個月裏,股價上漲了13%。
Since the stock has added US$6.9b to its market cap in the past week alone, let's see if underlying performance has been driving long-term returns.
由於該股市值在上週增加了69億美元,讓我們看看潛在表現是否推動了長期回報。
While markets are a powerful pricing mechanism, share prices reflect investor sentiment, not just underlying business performance. By comparing earnings per share (EPS) and share price changes over time, we can get a feel for how investor attitudes to a company have morphed over time.
儘管市場是一個強大的定價機制,股價不僅反映了基本業務表現,還反映了投資者的情緒。通過比較每股收益(EPS)和股價變化,並隨時間推移這樣做,我們可以了解股東對公司的態度如何隨時間變化。
Over half a decade, Freeport-McMoRan managed to grow its earnings per share at 14% a year. This EPS growth is lower than the 42% average annual increase in the share price. So it's fair to assume the market has a higher opinion of the business than it did five years ago. That's not necessarily surprising considering the five-year track record of earnings growth.
在過去五年中,麥克莫蘭銅金成功地將每股收益年均增長14%。這種每股收益增長低於股價年均增長42%的平均水平。因此,可以合理地假設市場對該業務的看法比五年前更高。考慮到過去五年的盈利增長記錄,這並非令人意外。
You can see how EPS has changed over time in the image below (click on the chart to see the exact values).
您可以在下面的圖片中查看每股收益如何隨時間變化(單擊圖表以查看確切的價值)。
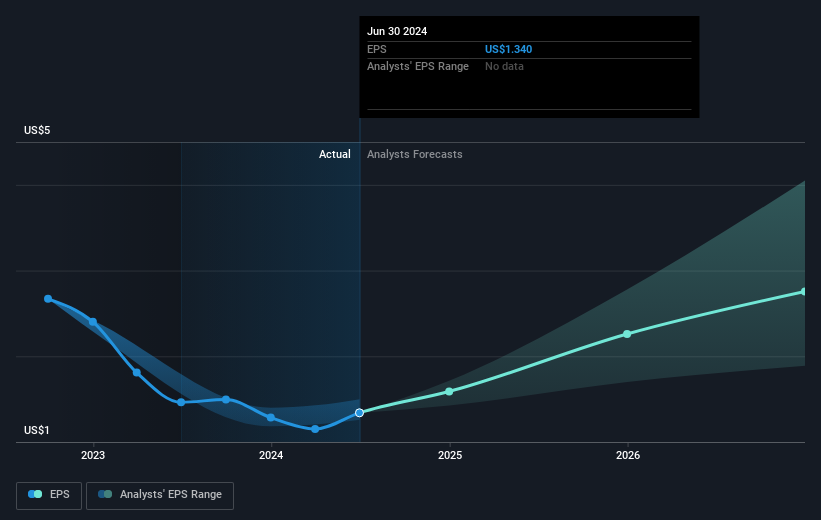
This free interactive report on Freeport-McMoRan's earnings, revenue and cash flow is a great place to start, if you want to investigate the stock further.
如果您想進一步調查這隻股票,麥克莫蘭銅金的收益、營業收入和現金流等方面的免費互動報告是一個很好的起點。
What About Dividends?
那麼分紅怎麼樣呢?
It is important to consider the total shareholder return, as well as the share price return, for any given stock. The TSR is a return calculation that accounts for the value of cash dividends (assuming that any dividend received was reinvested) and the calculated value of any discounted capital raisings and spin-offs. Arguably, the TSR gives a more comprehensive picture of the return generated by a stock. As it happens, Freeport-McMoRan's TSR for the last 5 years was 503%, which exceeds the share price return mentioned earlier. And there's no prize for guessing that the dividend payments largely explain the divergence!
對於任何給定的股票,考慮總股東回報以及股價回報至關重要。 TSR是一個回報計算,考慮到現金股利的價值(假設任何收到的股利都是再投資的)以及任何折扣資本募集和剝離的計算值。可以說,TSR給出了一張更全面的關於股票回報的圖片。事實上,麥克莫蘭銅金過去5年的TSR爲503%,超過了之前提到的股價回報。毫無疑問,股息支付在很大程度上解釋了這種分歧!
A Different Perspective
不同的觀點
Freeport-McMoRan's TSR for the year was broadly in line with the market average, at 38%. We should note here that the five-year TSR is more impressive, at 43% per year. More recently, the share price growth has slowed. But it has to be said the overall picture is one of good long term and short term performance. Arguably that makes Freeport-McMoRan a stock worth watching. Most investors take the time to check the data on insider transactions. You can click here to see if insiders have been buying or selling.
就去年來說,麥克莫蘭銅金的TSR大體上符合市場平均水平,爲38%。我們應該在這裏注意到,過去五年的TSR更爲亮眼,達到了每年43%。最近,股價增長有所放緩。但必須指出的是,總體情況是長期和短期表現都不錯。可以說這使得麥克莫蘭銅金成爲一個值得關注的股票。大多數投資者都會花時間查看內幕交易數據。您可以點擊這裏查看內部人員是否一直在買入或賣出。
For those who like to find winning investments this free list of undervalued companies with recent insider purchasing, could be just the ticket.
對於那些喜歡尋找獲勝投資的人來說,最近有內部購買的低估公司免費列表可能是一個很好的選擇。
Please note, the market returns quoted in this article reflect the market weighted average returns of stocks that currently trade on American exchanges.
請注意,本文所引述的市場回報反映了目前在美國交易所上市的股票的市場加權平均回報。
Have feedback on this article? Concerned about the content? Get in touch with us directly. Alternatively, email editorial-team (at) simplywallst.com.
This article by Simply Wall St is general in nature. We provide commentary based on historical data and analyst forecasts only using an unbiased methodology and our articles are not intended to be financial advice. It does not constitute a recommendation to buy or sell any stock, and does not take account of your objectives, or your financial situation. We aim to bring you long-term focused analysis driven by fundamental data. Note that our analysis may not factor in the latest price-sensitive company announcements or qualitative material. Simply Wall St has no position in any stocks mentioned.
對本文有任何反饋?對內容有任何疑慮?請直接與我們聯繫。或者,發送電子郵件至editorial-team@simplywallst.com。
這篇文章是Simply Wall St的一般性文章。我們根據歷史數據和分析師預測提供評論,只使用公正的方法論,我們的文章並不意味着提供任何金融建議。文章不構成買賣任何股票的建議,也不考慮您的目標或您的財務狀況。我們的目標是帶給您基本數據驅動的長期關注分析。請注意,我們的分析可能不考慮最新的價格敏感公司公告或定性材料。Simply Wall St沒有任何股票頭寸。
譯文內容由第三人軟體翻譯。
