
Investors in Spectrum Brands Holdings (NYSE:SPB) Have Seen Splendid Returns of 122% Over the Past Five Years
Investors in Spectrum Brands Holdings (NYSE:SPB) Have Seen Splendid Returns of 122% Over the Past Five Years
 During the five years of share price growth, Spectrum Brands Holdings moved from a loss to profitability. That would generally be considered a positive, so we'd hope to see the share price to rise.
 If you want to compound wealth in the stock market, you can do so by buying an index fund. But you can do a lot better than that by buying good quality businesses for attractive prices. For example, the Spectrum Brands Holdings, Inc. (NYSE:SPB) share price is 97% higher than it was five years ago, which is more than the market average. It's fair to say the stock has continued its long term trend in the last year, over which it has risen 22%.
如果您想在股市中複利致富,您可以通過購買指數基金來實現。但是,通過以有吸引力的價格購買優質企業,您可以做得更好。例如,spectrum brands控股公司(紐交所:SPB)的股價比五年前高出97%,高於市場平均水平。可以說,這支股票在過去一年中繼續了其長期趨勢,漲幅達到22%。
With that in mind, it's worth seeing if the company's underlying fundamentals have been the driver of long term performance, or if there are some discrepancies.
鑑於此,值得看看該公司的基本面是否一直是長期業績的驅動因素,或者是否存在一些不一致之處。
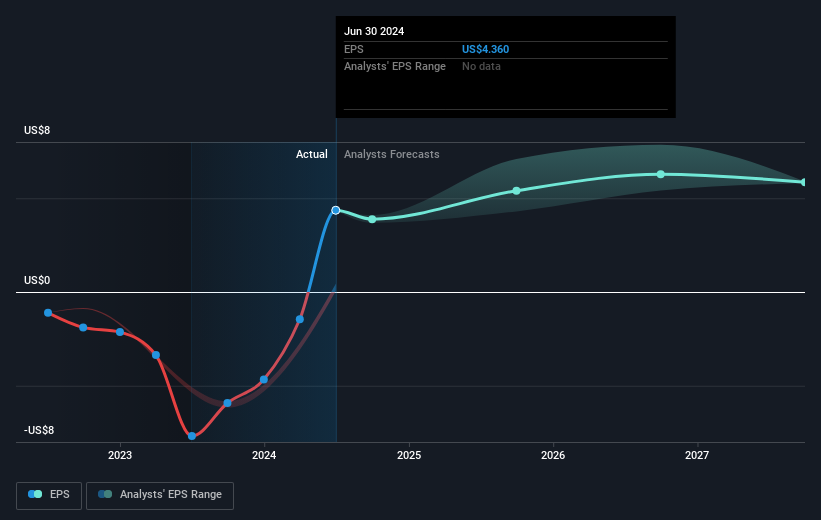
There is no denying that markets are sometimes efficient, but prices do not always reflect underlying business performance. One flawed but reasonable way to assess how sentiment around a company has changed is to compare the earnings per share (EPS) with the share price.
市場有時毫無疑問是有效的,但股票價格並不總是反映基本業務表現。一種有缺陷但合理的方法是比較每股收益(EPS)和股票價格,以評估圍繞公司的情緒如何變化。
During the five years of share price growth, Spectrum Brands Holdings moved from a loss to profitability. That would generally be considered a positive, so we'd hope to see the share price to rise.
在股價增長的五年期間,spectrum brands控股公司從虧損轉爲盈利。這通常被認爲是一個積極的跡象,因此我們希望看到股價上漲。
You can see below how EPS has changed over time (discover the exact values by clicking on the image).
下面可以看到每股收益隨時間的變化情況(通過點擊圖像來查看確切數值)。
We consider it positive that insiders have made significant purchases in the last year. Having said that, most people consider earnings and revenue growth trends to be a more meaningful guide to the business. Dive deeper into the earnings by checking this interactive graph of Spectrum Brands Holdings' earnings, revenue and cash flow.
我們認爲內部人士在過去一年內有重大購買是積極的。儘管如此,大多數人認爲收益和營業收入增長趨勢更具指導意義。通過查看Spectrum Brands Holdings的收益、營收和現金流的互動圖表來深入了解收益。
What About Dividends?
那麼分紅怎麼樣呢?
When looking at investment returns, it is important to consider the difference between total shareholder return (TSR) and share price return. The TSR is a return calculation that accounts for the value of cash dividends (assuming that any dividend received was reinvested) and the calculated value of any discounted capital raisings and spin-offs. Arguably, the TSR gives a more comprehensive picture of the return generated by a stock. We note that for Spectrum Brands Holdings the TSR over the last 5 years was 122%, which is better than the share price return mentioned above. And there's no prize for guessing that the dividend payments largely explain the divergence!
在考慮投資回報時,重要的是考慮總股東回報率(TSR)和股價回報之間的差異。 TSR是一個回報計算,考慮了現金股息的價值(假設任何收到的股息都已再投資)以及任何折扣後資本籌集和分拆的計算價值。可以說TSR更全面地展現了股票所產生的回報。我們注意到,對於Spectrum Brands Holdings,過去5年的TSR爲122%,優於上述股價回報。毋庸置疑,股息支付在很大程度上解釋了這種分歧!
A Different Perspective
不同的觀點
Spectrum Brands Holdings shareholders are up 25% for the year (even including dividends). But that was short of the market average. The silver lining is that the gain was actually better than the average annual return of 17% per year over five year. It is possible that returns will improve along with the business fundamentals. I find it very interesting to look at share price over the long term as a proxy for business performance. But to truly gain insight, we need to consider other information, too. Like risks, for instance. Every company has them, and we've spotted 2 warning signs for Spectrum Brands Holdings (of which 1 doesn't sit too well with us!) you should know about.
Spectrum Brands Holdings的股東在今年上漲了25%(包括股息在內)。但這低於市場平均水平。好消息是,這個增長實際上比過去5年平均每年17%的回報要好。隨着業務基本面的改善,回報可能會提高。從長期來看,股價可以作爲業務表現的代理,我覺得非常有趣。但要真正獲得洞察,我們還需要考慮其他信息。比如風險。每家公司都有風險,我們已經發現了Spectrum Brands Holdings的兩個警示信號(其中一個讓我們感到不太舒服!)你應該了解。
If you like to buy stocks alongside management, then you might just love this free list of companies. (Hint: most of them are flying under the radar).
如果您喜歡與管理層共同購買股票,那麼您可能會喜歡這個免費的公司列表(提示:大多數公司沒有受到關注)。
Please note, the market returns quoted in this article reflect the market weighted average returns of stocks that currently trade on American exchanges.
請注意,本文所引述的市場回報反映了目前在美國交易所上市的股票的市場加權平均回報。
Have feedback on this article? Concerned about the content? Get in touch with us directly. Alternatively, email editorial-team (at) simplywallst.com.
This article by Simply Wall St is general in nature. We provide commentary based on historical data and analyst forecasts only using an unbiased methodology and our articles are not intended to be financial advice. It does not constitute a recommendation to buy or sell any stock, and does not take account of your objectives, or your financial situation. We aim to bring you long-term focused analysis driven by fundamental data. Note that our analysis may not factor in the latest price-sensitive company announcements or qualitative material. Simply Wall St has no position in any stocks mentioned.
對本文有任何反饋?對內容有任何疑慮?請直接與我們聯繫。或者,發送電子郵件至editorial-team@simplywallst.com。
這篇文章是Simply Wall St的一般性文章。我們根據歷史數據和分析師預測提供評論,只使用公正的方法論,我們的文章並不意味着提供任何金融建議。文章不構成買賣任何股票的建議,也不考慮您的目標或您的財務狀況。我們的目標是帶給您基本數據驅動的長期關注分析。請注意,我們的分析可能不考慮最新的價格敏感公司公告或定性材料。Simply Wall St沒有任何股票頭寸。
譯文內容由第三人軟體翻譯。
