
Further Weakness as EyePoint Pharmaceuticals (NASDAQ:EYPT) Drops 12% This Week, Taking Five-year Losses to 54%
Further Weakness as EyePoint Pharmaceuticals (NASDAQ:EYPT) Drops 12% This Week, Taking Five-year Losses to 54%
 Over five years, EyePoint Pharmaceuticals grew its revenue at 18% per year. That's better than most loss-making companies. Unfortunately for shareholders the share price has dropped 9% per year - disappointing considering the growth. It's safe to say investor expectations are more grounded now. If you think the company can keep up its revenue growth, you'd have to consider the possibility that there's an opportunity here.
 Statistically speaking, long term investing is a profitable endeavour. But no-one is immune from buying too high. For example, after five long years the EyePoint Pharmaceuticals, Inc. (NASDAQ:EYPT) share price is a whole 54% lower. That is extremely sub-optimal, to say the least. The last week also saw the share price slip down another 12%.
從統計數據來看,長期投資是一項有利可圖的事業。但沒有人能免於買入過高。例如,經過五年時間,納斯達克眼點製藥公司(美國納斯達克股票代碼EYPT)的股價整整下跌了54%。這在某種程度上可以說是極其不理想。上週股價也再度下滑了12%。
Given the past week has been tough on shareholders, let's investigate the fundamentals and see what we can learn.
考慮到過去一週對股東來說是艱難的,讓我們調查一下基本面並看看我們能學到什麼。
Because EyePoint Pharmaceuticals made a loss in the last twelve months, we think the market is probably more focussed on revenue and revenue growth, at least for now. When a company doesn't make profits, we'd generally hope to see good revenue growth. Some companies are willing to postpone profitability to grow revenue faster, but in that case one would hope for good top-line growth to make up for the lack of earnings.
由於眼點製藥公司在過去十二個月間虧損,我們認爲市場可能更關注營業收入和營業收入增長,至少目前是這樣。當一家公司沒有盈利時,我們通常希望看到良好的營收增長。一些公司願意推遲盈利以更快地增長營收,但在這種情況下,人們希望看到良好的營收增長來彌補缺失的盈利。
Over five years, EyePoint Pharmaceuticals grew its revenue at 18% per year. That's better than most loss-making companies. Unfortunately for shareholders the share price has dropped 9% per year - disappointing considering the growth. It's safe to say investor expectations are more grounded now. If you think the company can keep up its revenue growth, you'd have to consider the possibility that there's an opportunity here.
在過去五年中,眼點製藥公司的營業收入年均增長18%。這比大多數虧損企業都要好。不幸的是,對股東而言,股價每年下跌9%,考慮到增長情況,這令人失望。可以說投資者的期望現在更爲現實。如果您認爲公司能夠維持營收增長,那麼您必須考慮這裏可能存在一個機會。
The graphic below depicts how earnings and revenue have changed over time (unveil the exact values by clicking on the image).
下面的圖表顯示了收益和營收隨時間的變化情況(通過單擊圖像揭示確切的值)。
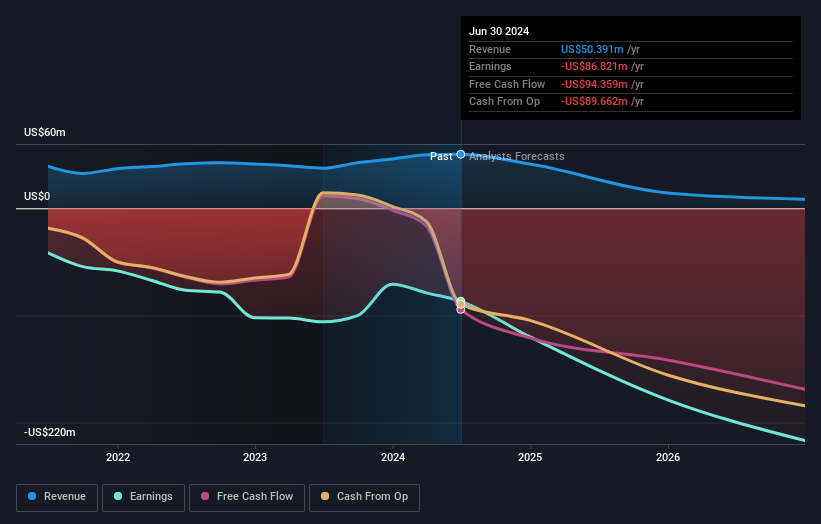
It's good to see that there was some significant insider buying in the last three months. That's a positive. That said, we think earnings and revenue growth trends are even more important factors to consider. So it makes a lot of sense to check out what analysts think EyePoint Pharmaceuticals will earn in the future (free profit forecasts).
很高興看到在過去的三個月裏有一些重大的內部買入。這是一個積極的信號。儘管如此,我們認爲收益和營業收入增長趨勢才是更重要的考慮因素。因此,查看分析師認爲EyePoint Pharmaceuticals未來將獲得多少收益(免費利潤預測)是非常有意義的。
A Different Perspective
不同的觀點
EyePoint Pharmaceuticals shareholders are up 0.9% for the year. Unfortunately this falls short of the market return. But at least that's still a gain! Over five years the TSR has been a reduction of 9% per year, over five years. So this might be a sign the business has turned its fortunes around. It's always interesting to track share price performance over the longer term. But to understand EyePoint Pharmaceuticals better, we need to consider many other factors. For example, we've discovered 3 warning signs for EyePoint Pharmaceuticals (1 is a bit concerning!) that you should be aware of before investing here.
EyePoint Pharmaceuticals股東今年上漲了0.9%。不幸的是,這低於市場回報率。但至少還是有所盈利!在五年內,TSR平均每年減少9%。因此,這可能是業務已經扭轉命運的跡象。長期追蹤股價表現總是很有趣。但要更好地了解EyePoint Pharmaceuticals,我們需要考慮許多其他因素。例如,我們已發現EyePoint Pharmaceuticals有3個警告信號(有1個有點令人擔憂!)在投資之前,您應該注意到這些信息。
EyePoint Pharmaceuticals is not the only stock insiders are buying. So take a peek at this free list of small cap companies at attractive valuations which insiders have been buying.
EyePoint Pharmaceuticals不是唯一一家內部人員在買入的股票。因此,查看這份免費名單,上面列出了一些小盤公司,這些公司具有吸引人的估值,內部人員一直在購買。
Please note, the market returns quoted in this article reflect the market weighted average returns of stocks that currently trade on American exchanges.
請注意,本文所引述的市場回報反映了目前在美國交易所上市的股票的市場加權平均回報。
Have feedback on this article? Concerned about the content? Get in touch with us directly. Alternatively, email editorial-team (at) simplywallst.com.
This article by Simply Wall St is general in nature. We provide commentary based on historical data and analyst forecasts only using an unbiased methodology and our articles are not intended to be financial advice. It does not constitute a recommendation to buy or sell any stock, and does not take account of your objectives, or your financial situation. We aim to bring you long-term focused analysis driven by fundamental data. Note that our analysis may not factor in the latest price-sensitive company announcements or qualitative material. Simply Wall St has no position in any stocks mentioned.
對本文有任何反饋?對內容有任何疑慮?請直接與我們聯繫。或者,發送電子郵件至editorial-team@simplywallst.com。
這篇文章是Simply Wall St的一般性文章。我們根據歷史數據和分析師預測提供評論,只使用公正的方法論,我們的文章並不意味着提供任何金融建議。文章不構成買賣任何股票的建議,也不考慮您的目標或您的財務狀況。我們的目標是帶給您基本數據驅動的長期關注分析。請注意,我們的分析可能不考慮最新的價格敏感公司公告或定性材料。Simply Wall St沒有任何股票頭寸。
譯文內容由第三人軟體翻譯。
