
Returns On Capital At CSX (NASDAQ:CSX) Have Hit The Brakes
Returns On Capital At CSX (NASDAQ:CSX) Have Hit The Brakes
 0.14 = US$5.5b ÷ (US$42b - US$2.7b)
 Finding a business that has the potential to grow substantially is not easy, but it is possible if we look at a few key financial metrics. One common approach is to try and find a company with returns on capital employed (ROCE) that are increasing, in conjunction with a growing amount of capital employed. Ultimately, this demonstrates that it's a business that is reinvesting profits at increasing rates of return. Having said that, from a first glance at CSX (NASDAQ:CSX) we aren't jumping out of our chairs at how returns are trending, but let's have a deeper look.
找到一個具有巨大增長潛力的企業並不容易,但如果我們關注一些關鍵的財務指標,這是可能的。一個常見的方法是嘗試找到一個ROCE逐漸增加的公司,同時資本額也在增加。最終,這表明這是一個以遞增的回報率再投資利潤的企業。話雖如此,初步看來,對於CSX(納斯達克:CSX),我們並不會對回報趨勢感到興奮,但讓我們更深入地看一看。
What Is Return On Capital Employed (ROCE)?
我們對 Enphase Energy 的資本僱用回報率的看法:正如我們上面看到的,Enphase Energy 的資本回報率沒有提高,但它正在重新投資於業務。投資者必須認爲未來會有更好的前景,因爲股票表現良好,使持股五年以上的股東獲得了 690% 的收益。最終,如果基本趨勢持續存在,我們不會對它成爲一隻多頭股持有期很久很有信心。
For those who don't know, ROCE is a measure of a company's yearly pre-tax profit (its return), relative to the capital employed in the business. To calculate this metric for CSX, this is the formula:
對於那些不了解的人,ROCE是一個公司每年稅前利潤(其回報)與企業中使用的資本相對比的度量。爲了計算CSX的這一指標,公式如下:
Return on Capital Employed = Earnings Before Interest and Tax (EBIT) ÷ (Total Assets - Current Liabilities)
資產僱用回報率(ROCE)是指企業利潤,即企業稅前利潤除以企業投入的總資本(負債加股權)。如果ROCE高於企業財務成本的承受能力,那麼企業就會創造出更多的價值。
0.14 = US$5.5b ÷ (US$42b - US$2.7b) (Based on the trailing twelve months to June 2024).
0.14 = 550億美元 ÷ (420億美元 - 2.7億美元)(截至2024年6月的過去十二個月)。
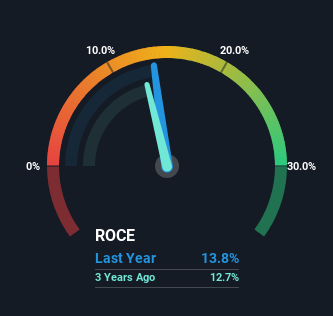
So, CSX has an ROCE of 14%. On its own, that's a standard return, however it's much better than the 7.7% generated by the Transportation industry.
所以,CSX的ROCE爲14%。單獨看來,這是一個標準的回報率,然而它比運輸行業產生的7.7%要好得多。
In the above chart we have measured CSX's prior ROCE against its prior performance, but the future is arguably more important. If you'd like to see what analysts are forecasting going forward, you should check out our free analyst report for CSX .
在上面的圖表中,我們已經測量了CSX之前的ROCE與其之前的業績,但未來可能更重要。如果您想了解分析師們未來的預測,您應該查看我們爲CSX準備的免費分析師報告。
What Can We Tell From CSX's ROCE Trend?
從CSX的ROCE趨勢中我們能得到什麼信息?
There hasn't been much to report for CSX's returns and its level of capital employed because both metrics have been steady for the past five years. It's not uncommon to see this when looking at a mature and stable business that isn't re-investing its earnings because it has likely passed that phase of the business cycle. So don't be surprised if CSX doesn't end up being a multi-bagger in a few years time.
近五年來,CSX的回報率和資本運用水平均保持穩定,因此並沒有太多報告可供參考。當看到一個成熟穩定的企業不再對盈利進行再投資時,這種情況並不罕見,因爲它可能已經過了業務週期的那個階段。所以如果CSX最終沒有在未來幾年成爲暴利股,也就不要感到驚訝了。
What We Can Learn From CSX's ROCE
我們能從CSX的ROCE中學到什麼?
In summary, CSX isn't compounding its earnings but is generating stable returns on the same amount of capital employed. Since the stock has gained an impressive 63% over the last five years, investors must think there's better things to come. Ultimately, if the underlying trends persist, we wouldn't hold our breath on it being a multi-bagger going forward.
總結一下,CSX沒有使其收益複利,但在相同資本運用量上產生了穩定回報。由於股價在過去五年裏飆升了驚人的63%,投資者可能認爲會有更好的發展。最終,如果潛在趨勢持續存在,我們不必指望它在未來成爲暴利股。
On a separate note, we've found 1 warning sign for CSX you'll probably want to know about.
另外,我們發現CSX存在1個警告信號,您可能想知道。
For those who like to invest in solid companies, check out this free list of companies with solid balance sheets and high returns on equity.
Hao Tian International Construction Investment Group確實存在一些風險,我們已經發現了一條警示標誌,你可能會感興趣。對於那些喜歡投資於實力雄厚的公司的人,可以查看這個由財務狀況強大、股本回報率高的公司組成的免費列表。
Have feedback on this article? Concerned about the content? Get in touch with us directly. Alternatively, email editorial-team (at) simplywallst.com.
This article by Simply Wall St is general in nature. We provide commentary based on historical data and analyst forecasts only using an unbiased methodology and our articles are not intended to be financial advice. It does not constitute a recommendation to buy or sell any stock, and does not take account of your objectives, or your financial situation. We aim to bring you long-term focused analysis driven by fundamental data. Note that our analysis may not factor in the latest price-sensitive company announcements or qualitative material. Simply Wall St has no position in any stocks mentioned.
對本文有任何反饋?對內容有任何疑慮?請直接與我們聯繫。或者,發送電子郵件至editorial-team@simplywallst.com。
這篇文章是Simply Wall St的一般性文章。我們根據歷史數據和分析師預測提供評論,只使用公正的方法論,我們的文章並不意味着提供任何金融建議。文章不構成買賣任何股票的建議,也不考慮您的目標或您的財務狀況。我們的目標是帶給您基本數據驅動的長期關注分析。請注意,我們的分析可能不考慮最新的價格敏感公司公告或定性材料。Simply Wall St沒有任何股票頭寸。
譯文內容由第三人軟體翻譯。