
Investors in QuidelOrtho (NASDAQ:QDEL) Have Unfortunately Lost 67% Over the Last Three Years
Investors in QuidelOrtho (NASDAQ:QDEL) Have Unfortunately Lost 67% Over the Last Three Years
 QuidelOrtho saw its share price decline over the three years in which its EPS also dropped, falling to a loss. Since the company has fallen to a loss making position, it's hard to compare the change in EPS with the share price change. However, we can say we'd expect to see a falling share price in this scenario.
 QuidelOrtho Corporation (NASDAQ:QDEL) shareholders will doubtless be very grateful to see the share price up 34% in the last quarter. But that doesn't change the fact that the returns over the last three years have been disappointing. Indeed, the share price is down a tragic 67% in the last three years. Some might say the recent bounce is to be expected after such a bad drop. The rise has some hopeful, but turnarounds are often precarious.
窺得兒醫藥公司(納斯達克:QDEL)的股東們無疑會很感激,在過去一個季度裏看到股價上漲了34%。但這並不能改變過去三年收益令人失望的事實。事實上,過去三年股價下跌了慘重的67%。有人可能會說最近的反彈在經歷如此大的下跌之後是可以預料的。上漲讓一些人抱有希望,但轉機往往是危險的。
Now let's have a look at the company's fundamentals, and see if the long term shareholder return has matched the performance of the underlying business.
現在讓我們看看這家公司的基本面,看看長期股東回報是否與基礎業務的表現相匹配。
In his essay The Superinvestors of Graham-and-Doddsville Warren Buffett described how share prices do not always rationally reflect the value of a business. One way to examine how market sentiment has changed over time is to look at the interaction between a company's share price and its earnings per share (EPS).
在他的《格雷厄姆和道德斯維爾的超級投資者》一文中,禾倫·巴菲特描述了股價並不總是合理反映企業價值的方法。檢驗市場情緒如何隨時間變化的一種方法是觀察公司股價和每股收益(EPS)之間的互動關係。
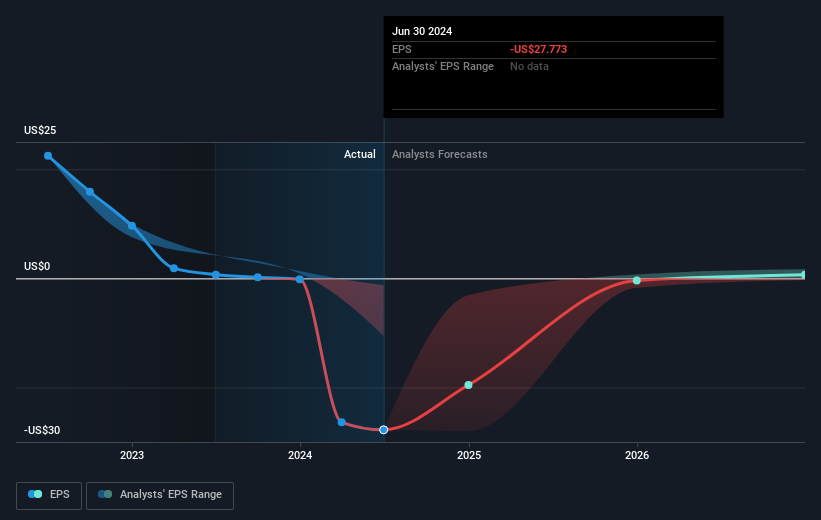
QuidelOrtho saw its share price decline over the three years in which its EPS also dropped, falling to a loss. Since the company has fallen to a loss making position, it's hard to compare the change in EPS with the share price change. However, we can say we'd expect to see a falling share price in this scenario.
在過去三年中,窺得兒看到其股價下跌,同時其每股收益也下降至虧損。由於該公司陷入虧損,很難將每股收益變化與股價變化進行比較。然而,在這種情況下,我們可以說我們預計會看到股價下跌。
You can see below how EPS has changed over time (discover the exact values by clicking on the image).
下面可以看到每股收益隨時間的變化情況(通過點擊圖像來查看確切數值)。
Dive deeper into QuidelOrtho's key metrics by checking this interactive graph of QuidelOrtho's earnings, revenue and cash flow.
通過查看QuidelOrtho的收益、營業收入和現金流互動圖表,深入了解QuidelOrtho的關鍵指標。
A Different Perspective
不同的觀點
QuidelOrtho shareholders are down 36% for the year, but the market itself is up 35%. However, keep in mind that even the best stocks will sometimes underperform the market over a twelve month period. Unfortunately, last year's performance may indicate unresolved challenges, given that it was worse than the annualised loss of 4% over the last half decade. We realise that Baron Rothschild has said investors should "buy when there is blood on the streets", but we caution that investors should first be sure they are buying a high quality business. It's always interesting to track share price performance over the longer term. But to understand QuidelOrtho better, we need to consider many other factors. For instance, we've identified 1 warning sign for QuidelOrtho that you should be aware of.
QuidelOrtho的股東今年下跌了36%,但市場本身上漲了35%。 但請記住,即使是最好的股票有時也會在十二個月的週期中表現不佳。 不幸的是,去年的表現可能表明存在尚未解決的挑戰,因爲它比過去半個世紀的年化虧損4%還要糟糕。 我們意識到,巴倫·羅斯柴爾德曾說過,投資者應在「街頭有鮮血時買入」,但我們警告投資者首先要確保他們在購買一個高質量的企業。 跟蹤股價長期表現總是很有趣。 但爲了更好地了解QuidelOrtho,我們需要考慮許多其他因素。 例如,我們已經發現了1個QuidelOrtho的警告信號,您應該注意。
If you would prefer to check out another company -- one with potentially superior financials -- then do not miss this free list of companies that have proven they can grow earnings.
如果您願意查看另一家公司(具有潛在的更好財務狀況),請不要錯過這個免費的公司列表,證明它們可以增長收益。
Please note, the market returns quoted in this article reflect the market weighted average returns of stocks that currently trade on American exchanges.
請注意,本文所引述的市場回報反映了目前在美國交易所上市的股票的市場加權平均回報。
Have feedback on this article? Concerned about the content? Get in touch with us directly. Alternatively, email editorial-team (at) simplywallst.com.
This article by Simply Wall St is general in nature. We provide commentary based on historical data and analyst forecasts only using an unbiased methodology and our articles are not intended to be financial advice. It does not constitute a recommendation to buy or sell any stock, and does not take account of your objectives, or your financial situation. We aim to bring you long-term focused analysis driven by fundamental data. Note that our analysis may not factor in the latest price-sensitive company announcements or qualitative material. Simply Wall St has no position in any stocks mentioned.
對本文有任何反饋?對內容有任何疑慮?請直接與我們聯繫。或者,發送電子郵件至editorial-team@simplywallst.com。
這篇文章是Simply Wall St的一般性文章。我們根據歷史數據和分析師預測提供評論,只使用公正的方法論,我們的文章並不意味着提供任何金融建議。文章不構成買賣任何股票的建議,也不考慮您的目標或您的財務狀況。我們的目標是帶給您基本數據驅動的長期關注分析。請注意,我們的分析可能不考慮最新的價格敏感公司公告或定性材料。Simply Wall St沒有任何股票頭寸。
譯文內容由第三人軟體翻譯。
