
D.R. Horton (NYSE:DHI) Shareholders Have Earned a 31% CAGR Over the Last Five Years
D.R. Horton (NYSE:DHI) Shareholders Have Earned a 31% CAGR Over the Last Five Years
 Over half a decade, D.R. Horton managed to grow its earnings per share at 29% a year. This EPS growth is remarkably close to the 30% average annual increase in the share price. That suggests that the market sentiment around the company hasn't changed much over that time. Indeed, it would appear the share price is reacting to the EPS.
 When you buy a stock there is always a possibility that it could drop 100%. But on a lighter note, a good company can see its share price rise well over 100%. One great example is D.R. Horton, Inc. (NYSE:DHI) which saw its share price drive 267% higher over five years. On top of that, the share price is up 38% in about a quarter.
當您買入一支股票時,總會有可能下跌100%。但值得一提的是,一家好公司的股價可能會上漲超過100%。一個很好的例子就是霍頓房屋公司(紐交所:DHI),在過去五年裏其股價上漲了267%。除此之外,股價在大約一個季度內上漲了38%。
Let's take a look at the underlying fundamentals over the longer term, and see if they've been consistent with shareholders returns.
讓我們長期看一下潛在的基本面,看看它們是否與股東回報一致。
In his essay The Superinvestors of Graham-and-Doddsville Warren Buffett described how share prices do not always rationally reflect the value of a business. One way to examine how market sentiment has changed over time is to look at the interaction between a company's share price and its earnings per share (EPS).
在他的《格雷厄姆和道德斯維爾的超級投資者》一文中,禾倫·巴菲特描述了股價並不總是合理反映企業價值的方法。檢驗市場情緒如何隨時間變化的一種方法是觀察公司股價和每股收益(EPS)之間的互動關係。
Over half a decade, D.R. Horton managed to grow its earnings per share at 29% a year. This EPS growth is remarkably close to the 30% average annual increase in the share price. That suggests that the market sentiment around the company hasn't changed much over that time. Indeed, it would appear the share price is reacting to the EPS.
在半個世紀的時間裏,霍頓房屋設法將其每股收益增長率保持在29%。這一每股收益增長率與股價平均每年增長30%的數據非常接近。這表明市場對該公司的情緒在這段時間內沒有發生太大變化。事實上,股價似乎是對每股收益做出了反應。
You can see how EPS has changed over time in the image below (click on the chart to see the exact values).
您可以在下面的圖片中查看每股收益如何隨時間變化(單擊圖表以查看確切的價值)。
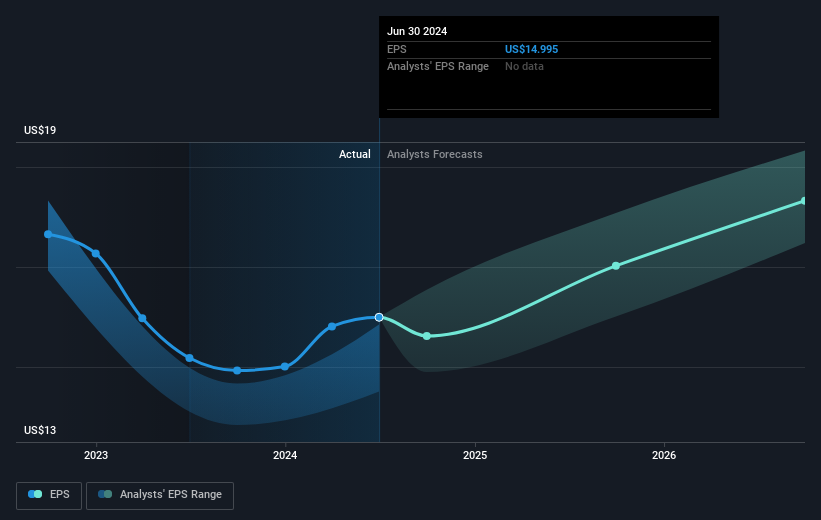
Dive deeper into D.R. Horton's key metrics by checking this interactive graph of D.R. Horton's earnings, revenue and cash flow.
通過查看霍頓房屋收入、營業收入和現金流的互動圖表,深入了解霍頓房屋的關鍵指標。
What About Dividends?
那麼分紅怎麼樣呢?
When looking at investment returns, it is important to consider the difference between total shareholder return (TSR) and share price return. The TSR is a return calculation that accounts for the value of cash dividends (assuming that any dividend received was reinvested) and the calculated value of any discounted capital raisings and spin-offs. It's fair to say that the TSR gives a more complete picture for stocks that pay a dividend. In the case of D.R. Horton, it has a TSR of 286% for the last 5 years. That exceeds its share price return that we previously mentioned. The dividends paid by the company have thusly boosted the total shareholder return.
在考慮投資回報時,重要的是要考慮總股東回報率(TSR)與股價回報之間的差異。TSR是一種返回計算,考慮到現金分紅的價值(假設任何收到的紅利都已再投資)和任何折讓的增資和拆股的計算價值。可以說TSR爲支付股息的股票提供了更完整的圖片。就霍頓房屋而言,其過去5年的TSR爲286%。這超過了我們之前提到的股價回報。因此,公司支付的股息提高了總股東回報。
A Different Perspective
不同的觀點
It's nice to see that D.R. Horton shareholders have received a total shareholder return of 80% over the last year. That's including the dividend. That's better than the annualised return of 31% over half a decade, implying that the company is doing better recently. In the best case scenario, this may hint at some real business momentum, implying that now could be a great time to delve deeper. Before spending more time on D.R. Horton it might be wise to click here to see if insiders have been buying or selling shares.
很高興看到霍頓房屋股東在過去一年內獲得了80%的總股東回報。這已包括了股息。這比過去半個世紀的年化回報率31%要好,意味着公司最近的表現更好。在最佳情況下,這可能暗示着一些真正的業務勢頭,暗示現在可能是深入了解的好時機。在花更多時間了解霍頓房屋之前,可能明智的做法是點擊這裏查看內部人是否一直在買入或賣出股票。
If you are like me, then you will not want to miss this free list of undervalued small caps that insiders are buying.
如果您像我一樣,就不會希望錯過這份免費的內部人士正在購買的低估小市值股票列表。
Please note, the market returns quoted in this article reflect the market weighted average returns of stocks that currently trade on American exchanges.
請注意,本文所引述的市場回報反映了目前在美國交易所上市的股票的市場加權平均回報。
Have feedback on this article? Concerned about the content? Get in touch with us directly. Alternatively, email editorial-team (at) simplywallst.com.
This article by Simply Wall St is general in nature. We provide commentary based on historical data and analyst forecasts only using an unbiased methodology and our articles are not intended to be financial advice. It does not constitute a recommendation to buy or sell any stock, and does not take account of your objectives, or your financial situation. We aim to bring you long-term focused analysis driven by fundamental data. Note that our analysis may not factor in the latest price-sensitive company announcements or qualitative material. Simply Wall St has no position in any stocks mentioned.
對本文有任何反饋?對內容有任何疑慮?請直接與我們聯繫。或者,發送電子郵件至editorial-team@simplywallst.com。
這篇文章是Simply Wall St的一般性文章。我們根據歷史數據和分析師預測提供評論,只使用公正的方法論,我們的文章並不意味着提供任何金融建議。文章不構成買賣任何股票的建議,也不考慮您的目標或您的財務狀況。我們的目標是帶給您基本數據驅動的長期關注分析。請注意,我們的分析可能不考慮最新的價格敏感公司公告或定性材料。Simply Wall St沒有任何股票頭寸。
譯文內容由第三人軟體翻譯。