
Those Who Invested in CMS Energy (NYSE:CMS) a Year Ago Are up 29%
Those Who Invested in CMS Energy (NYSE:CMS) a Year Ago Are up 29%
 CMS Energy was able to grow EPS by 30% in the last twelve months. It's fair to say that the share price gain of 25% did not keep pace with the EPS growth. So it seems like the market has cooled on CMS Energy, despite the growth. Interesting.
 On average, over time, stock markets tend to rise higher. This makes investing attractive. But if when you choose to buy stocks, some of them will be below average performers. Unfortunately for shareholders, while the CMS Energy Corporation (NYSE:CMS) share price is up 25% in the last year, that falls short of the market return. The longer term returns have not been as good, with the stock price only 17% higher than it was three years ago.
平均而言,股市隨着時間的推移往往會上漲。這使得投資變得更有吸引力。但是當您選擇購買股票時,其中一些股票的表現會低於平均水平。遺憾的是,雖然CMS能源公司(紐交所:CMS)的股價在過去一年中上漲了25%,但跑輸了市場回報。長期回報並不那麼理想,股價比三年前僅高出17%。
With that in mind, it's worth seeing if the company's underlying fundamentals have been the driver of long term performance, or if there are some discrepancies.
鑑於此,值得看看該公司的基本面是否一直是長期業績的驅動因素,或者是否存在一些不一致之處。
To quote Buffett, 'Ships will sail around the world but the Flat Earth Society will flourish. There will continue to be wide discrepancies between price and value in the marketplace...' By comparing earnings per share (EPS) and share price changes over time, we can get a feel for how investor attitudes to a company have morphed over time.
引用巴菲特的話順便說一下,「船隻將環遊世界,但支持地球平面學會的人將大有可爲。 在市場上,價格和價值之間將繼續存在巨大的差異...」通過比較EPS和股價變化,我們可以了解到投資者對公司的態度隨時間的變化程度。
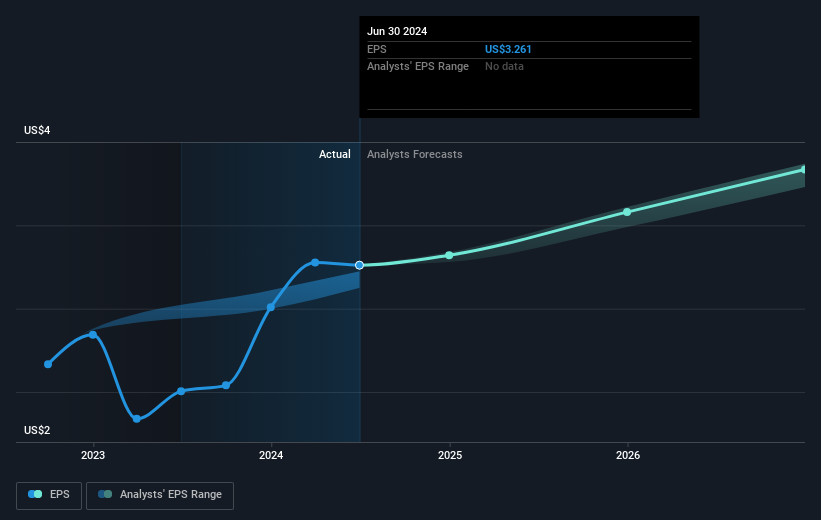
CMS Energy was able to grow EPS by 30% in the last twelve months. It's fair to say that the share price gain of 25% did not keep pace with the EPS growth. So it seems like the market has cooled on CMS Energy, despite the growth. Interesting.
CMS能源在過去十二個月成功將每股收益增長30%。可以說,股價上漲25%與每股收益增長的步伐不相符。因此,市場似乎對CMS能源表現得冷淡,儘管它有增長。有趣。
You can see how EPS has changed over time in the image below (click on the chart to see the exact values).
您可以在下面的圖片中查看每股收益如何隨時間變化(單擊圖表以查看確切的價值)。
We know that CMS Energy has improved its bottom line lately, but is it going to grow revenue? This free report showing analyst revenue forecasts should help you figure out if the EPS growth can be sustained.
我們知道康哲藥業最近改善了其底線,但它將增長營業收入嗎? 這份顯示分析師營業收入預測的免費報告應該幫助您確定EPS增長是否能持續。
What About Dividends?
那麼分紅怎麼樣呢?
It is important to consider the total shareholder return, as well as the share price return, for any given stock. The TSR incorporates the value of any spin-offs or discounted capital raisings, along with any dividends, based on the assumption that the dividends are reinvested. Arguably, the TSR gives a more comprehensive picture of the return generated by a stock. As it happens, CMS Energy's TSR for the last 1 year was 29%, which exceeds the share price return mentioned earlier. And there's no prize for guessing that the dividend payments largely explain the divergence!
重要考慮任何給定股票的總股東回報以及股價回報。 TSR包括任何分拆或折價募資的價值,以及基於股息被再投資的假設。可以說,TSR給出了股票產生的回報更全面的圖片。 正如情況所示,cms能源過去1年的TSR爲29%,超過了之前提到的股價回報。 毫無疑問,股息支付在很大程度上解釋了這種分歧!
A Different Perspective
不同的觀點
CMS Energy's TSR for the year was broadly in line with the market average, at 29%. That gain looks pretty satisfying, and it is even better than the five-year TSR of 5% per year. Even if the share price growth slows down from here, there's a good chance that this is business worth watching in the long term. While it is well worth considering the different impacts that market conditions can have on the share price, there are other factors that are even more important. Like risks, for instance. Every company has them, and we've spotted 3 warning signs for CMS Energy (of which 1 is significant!) you should know about.
cms能源今年的TSR基本與市場平均水平持平,爲29%。 這種增長看起來相當令人滿意,甚至比每年5%的五年TSR更好。 即使股價增長從此處放緩,這仍有很大可能是值得長期關注的業務。 雖然值得考慮市場狀況可能對股價產生的不同影響,但還有其他更爲重要的因素。 像風險這類的。 每家公司都會面臨風險,我們已經發現康哲藥業存在3個警示跡象(其中1個較爲顯著!)您應該知曉。
If you are like me, then you will not want to miss this free list of undervalued small caps that insiders are buying.
如果您像我一樣,就不會希望錯過這份免費的內部人士正在購買的低估小市值股票列表。
Please note, the market returns quoted in this article reflect the market weighted average returns of stocks that currently trade on American exchanges.
請注意,本文所引述的市場回報反映了目前在美國交易所上市的股票的市場加權平均回報。
Have feedback on this article? Concerned about the content? Get in touch with us directly. Alternatively, email editorial-team (at) simplywallst.com.
This article by Simply Wall St is general in nature. We provide commentary based on historical data and analyst forecasts only using an unbiased methodology and our articles are not intended to be financial advice. It does not constitute a recommendation to buy or sell any stock, and does not take account of your objectives, or your financial situation. We aim to bring you long-term focused analysis driven by fundamental data. Note that our analysis may not factor in the latest price-sensitive company announcements or qualitative material. Simply Wall St has no position in any stocks mentioned.
對本文有任何反饋?對內容有任何疑慮?請直接與我們聯繫。或者,發送電子郵件至editorial-team@simplywallst.com。
這篇文章是Simply Wall St的一般性文章。我們根據歷史數據和分析師預測提供評論,只使用公正的方法論,我們的文章並不意味着提供任何金融建議。文章不構成買賣任何股票的建議,也不考慮您的目標或您的財務狀況。我們的目標是帶給您基本數據驅動的長期關注分析。請注意,我們的分析可能不考慮最新的價格敏感公司公告或定性材料。Simply Wall St沒有任何股票頭寸。
譯文內容由第三人軟體翻譯。