
Investing in DexCom (NASDAQ:DXCM) Five Years Ago Would Have Delivered You a 89% Gain
Investing in DexCom (NASDAQ:DXCM) Five Years Ago Would Have Delivered You a 89% Gain
 During the five years of share price growth, DexCom moved from a loss to profitability. That would generally be considered a positive, so we'd hope to see the share price to rise. Given that the company made a profit three years ago, but not five years ago, it is worth looking at the share price returns over the last three years, too. In fact, the DexCom stock price is 49% lower in the last three years. Meanwhile, EPS is up 4.5% per year. So there seems to be a mismatch between the positive EPS growth and the change in the share price, which is down -20% per year.
 DexCom, Inc. (NASDAQ:DXCM) shareholders might understandably be very concerned that the share price has dropped 36% in the last quarter. But at least the stock is up over the last five years. In that time, it is up 89%, which isn't bad, but is below the market return of 106%. While the returns over the last 5 years have been good, we do feel sorry for those shareholders who haven't held shares that long, because the share price is down 49% in the last three years.
德康醫療公司(納斯達克股票代碼:DXCM)的股東可能會非常擔心股價在上個季度下跌了36%。 但至少在過去的五年裏,股價上漲了。 在這段時間內,股價增長了89%,這不錯,但低於市場回報率106%。 雖然過去5年的回報表現不錯,但我們爲那些持股時間不長的股東感到遺憾,因爲股價在過去3年下跌了49%。
Now it's worth having a look at the company's fundamentals too, because that will help us determine if the long term shareholder return has matched the performance of the underlying business.
現在值得更詳細地了解該公司的基本面,因爲這將幫助我們判斷長期股東回報是否與基礎業務的表現相匹配。
To paraphrase Benjamin Graham: Over the short term the market is a voting machine, but over the long term it's a weighing machine. One way to examine how market sentiment has changed over time is to look at the interaction between a company's share price and its earnings per share (EPS).
用本傑明·格雷厄姆的話來說:「短期市場是一臺投票機,但長期市場是一臺稱重機」。檢查市場情緒如何隨時間推移變化的一種方式是查看公司股價和每股收益(EPS)之間的相互作用。
During the five years of share price growth, DexCom moved from a loss to profitability. That would generally be considered a positive, so we'd hope to see the share price to rise. Given that the company made a profit three years ago, but not five years ago, it is worth looking at the share price returns over the last three years, too. In fact, the DexCom stock price is 49% lower in the last three years. Meanwhile, EPS is up 4.5% per year. So there seems to be a mismatch between the positive EPS growth and the change in the share price, which is down -20% per year.
在五年的股價增長期間,德康醫療公司已經經歷了從虧損到盈利。 這通常會被認爲是一個積極的信號,所以我們希望看到股價上漲。 鑑於公司三年前開始盈利,但五年前還未盈利,值得關注過去三年股價的回報率。 實際上,德康醫療股價在過去三年中下跌了49%。 與此同時,每股收益每年增長4.5%。 因此,正面的每股收益增長和股價變化之間似乎存在不匹配,股價年均下跌了-20%。
You can see how EPS has changed over time in the image below (click on the chart to see the exact values).
您可以在下面的圖片中查看每股收益如何隨時間變化(單擊圖表以查看確切的價值)。
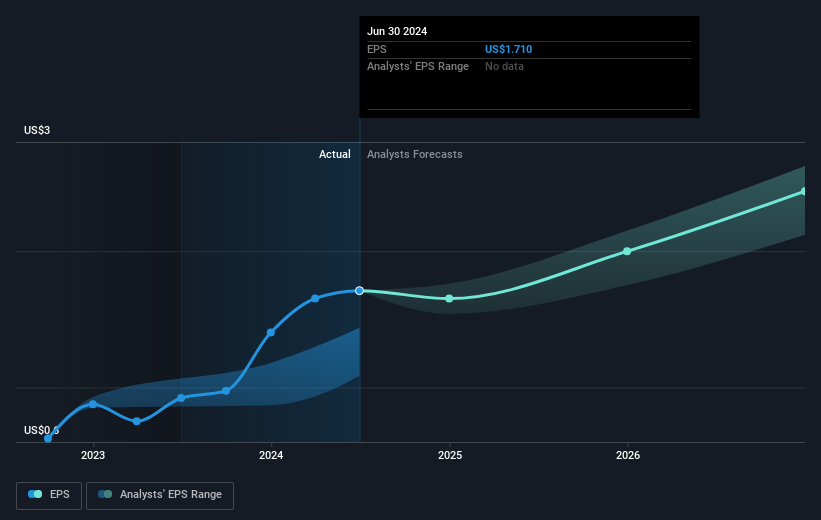
We know that DexCom has improved its bottom line lately, but is it going to grow revenue? This free report showing analyst revenue forecasts should help you figure out if the EPS growth can be sustained.
我們知道德康醫療最近改善了其底線,但它是否將增長營業收入?這份顯示分析師營業收入預測的免費報告應該能幫助你判斷EPS增長是否可持續。
A Different Perspective
不同的觀點
While the broader market gained around 32% in the last year, DexCom shareholders lost 18%. Even the share prices of good stocks drop sometimes, but we want to see improvements in the fundamental metrics of a business, before getting too interested. On the bright side, long term shareholders have made money, with a gain of 14% per year over half a decade. It could be that the recent sell-off is an opportunity, so it may be worth checking the fundamental data for signs of a long term growth trend. While it is well worth considering the different impacts that market conditions can have on the share price, there are other factors that are even more important. Take risks, for example - DexCom has 2 warning signs we think you should be aware of.
儘管過去一年中市場整體上漲了約32%,但德康醫療股東卻虧損了18%。即使是好股票的股價有時也會下跌,但我們希望看到業務的基本指標有所改善,才會產生興趣。從積極的一面來看,長期股東已經賺錢,過去半個世紀年均增長了14%。最近的拋售可能是一個機會,因此值得檢查基本數據,以了解長期增長趨勢的跡象。雖然考慮市場狀況對股價可能造成的不同影響非常重要,但還有其他更重要的因素。例如,承擔風險 - 德康醫療存在2個警示信號,我們認爲你應該注意。
Of course, you might find a fantastic investment by looking elsewhere. So take a peek at this free list of companies we expect will grow earnings.
當然,您可能在其他地方找到一家出色的企業進行投資。因此,請查看我們預計將實現盈利增長的公司的免費列表。
Please note, the market returns quoted in this article reflect the market weighted average returns of stocks that currently trade on American exchanges.
請注意,本文所引述的市場回報反映了目前在美國交易所上市的股票的市場加權平均回報。
Have feedback on this article? Concerned about the content? Get in touch with us directly. Alternatively, email editorial-team (at) simplywallst.com.
This article by Simply Wall St is general in nature. We provide commentary based on historical data and analyst forecasts only using an unbiased methodology and our articles are not intended to be financial advice. It does not constitute a recommendation to buy or sell any stock, and does not take account of your objectives, or your financial situation. We aim to bring you long-term focused analysis driven by fundamental data. Note that our analysis may not factor in the latest price-sensitive company announcements or qualitative material. Simply Wall St has no position in any stocks mentioned.
對本文有任何反饋?對內容有任何疑慮?請直接與我們聯繫。或者,發送電子郵件至editorial-team@simplywallst.com。
這篇文章是Simply Wall St的一般性文章。我們根據歷史數據和分析師預測提供評論,只使用公正的方法論,我們的文章並不意味着提供任何金融建議。文章不構成買賣任何股票的建議,也不考慮您的目標或您的財務狀況。我們的目標是帶給您基本數據驅動的長期關注分析。請注意,我們的分析可能不考慮最新的價格敏感公司公告或定性材料。Simply Wall St沒有任何股票頭寸。
譯文內容由第三人軟體翻譯。