
Veeco Instruments (NASDAQ:VECO) Climbs 3.4% This Week, Taking Five-year Gains to 171%
Veeco Instruments (NASDAQ:VECO) Climbs 3.4% This Week, Taking Five-year Gains to 171%
 During the five years of share price growth, Veeco Instruments moved from a loss to profitability. Sometimes, the start of profitability is a major inflection point that can signal fast earnings growth to come, which in turn justifies very strong share price gains. Since the company was unprofitable five years ago, but not three years ago, it's worth taking a look at the returns in the last three years, too. We can see that the Veeco Instruments share price is up 35% in the last three years. In the same period, EPS is up 97% per year. This EPS growth is higher than the 10% average annual increase in the share price over the same three years. Therefore, it seems the market has moderated its expectations for growth, somewhat.
 The last three months have been tough on Veeco Instruments Inc. (NASDAQ:VECO) shareholders, who have seen the share price decline a rather worrying 32%. But in stark contrast, the returns over the last half decade have impressed. We think most investors would be happy with the 171% return, over that period. Generally speaking the long term returns will give you a better idea of business quality than short periods can. The more important question is whether the stock is too cheap or too expensive today.
過去三個月對維易科精密儀器股票持有者來說是艱難的,股價下跌了32%,令人擔憂。但截然相反的是,在過去的半個世紀裏,收益給人留下了深刻印象。我們認爲大多數投資者會對這段時間內的171%回報感到滿意。一般來說,長期回報將更好地反映企業品質,而非短期僅能體現的。更重要的問題是,當前股票是太便宜還是太昂貴。
After a strong gain in the past week, it's worth seeing if longer term returns have been driven by improving fundamentals.
在過去的一週之內,獲得的強勁收益是否表明了長期回報受到基本面的推動值得關注。
There is no denying that markets are sometimes efficient, but prices do not always reflect underlying business performance. One flawed but reasonable way to assess how sentiment around a company has changed is to compare the earnings per share (EPS) with the share price.
市場有時毫無疑問是有效的,但股票價格並不總是反映基本業務表現。一種有缺陷但合理的方法是比較每股收益(EPS)和股票價格,以評估圍繞公司的情緒如何變化。
During the five years of share price growth, Veeco Instruments moved from a loss to profitability. Sometimes, the start of profitability is a major inflection point that can signal fast earnings growth to come, which in turn justifies very strong share price gains. Since the company was unprofitable five years ago, but not three years ago, it's worth taking a look at the returns in the last three years, too. We can see that the Veeco Instruments share price is up 35% in the last three years. In the same period, EPS is up 97% per year. This EPS growth is higher than the 10% average annual increase in the share price over the same three years. Therefore, it seems the market has moderated its expectations for growth, somewhat.
在股價增長的五年中,維易科精密儀器實現了從虧損到盈利。有時,盈利的開始是一個重要的轉折點,可以預示着未來快速收益增長,從而合理地支撐了股價的大幅增長。由於公司五年前處於虧損狀態,但三年前不是,因此值得細看過去三年的回報。我們可以看到,維易科精密儀器股價在過去三年中上漲了35%。在同一時期,每股收益年增長爲97%。這一每股收益增長高於同一三年內股價的10%年均增長。因此,市場似乎已經對增長預期進行了一定的調整。
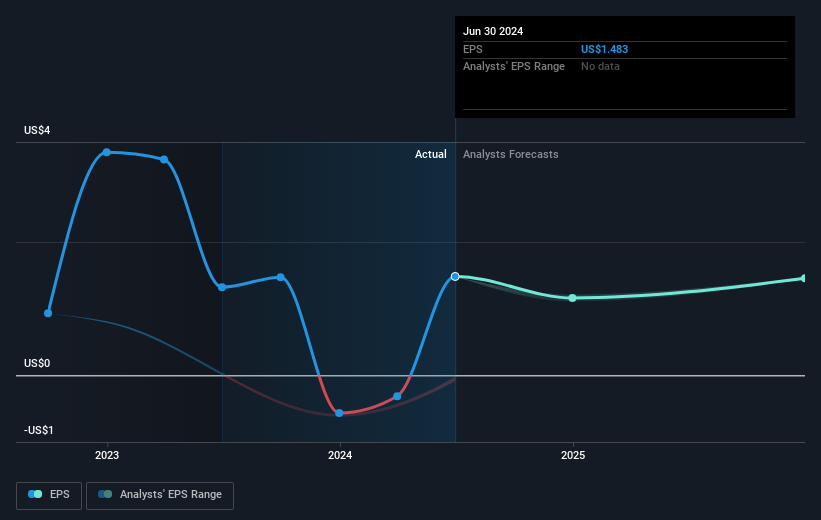
You can see how EPS has changed over time in the image below (click on the chart to see the exact values).
您可以在下面的圖片中查看每股收益如何隨時間變化(單擊圖表以查看確切的價值)。
It is of course excellent to see how Veeco Instruments has grown profits over the years, but the future is more important for shareholders. You can see how its balance sheet has strengthened (or weakened) over time in this free interactive graphic.
看到維易科精密儀器多年來利潤增長當然是極好的,但對股東來說未來更加重要。您可以通過這個免費互動圖形看到其資產負債表如何隨時間而強化(或減弱)。
A Different Perspective
不同的觀點
Veeco Instruments shareholders are up 17% for the year. Unfortunately this falls short of the market return. It's probably a good sign that the company has an even better long term track record, having provided shareholders with an annual TSR of 22% over five years. It's quite possible the business continues to execute with prowess, even as the share price gains are slowing. If you would like to research Veeco Instruments in more detail then you might want to take a look at whether insiders have been buying or selling shares in the company.
維易科精密儀器股東今年的回報率爲17%。不幸的是,這低於市場回報。可能公司長期表現更好是個好兆頭,過去五年爲股東提供了每年22%的總股東回報率。公司繼續高效運營的可能性很大,即使股價漲幅有所放緩。如果您想更詳細地研究維易科精密儀器,您可能需要查看內部人員是否一直在買入或賣出股票。
If you like to buy stocks alongside management, then you might just love this free list of companies. (Hint: many of them are unnoticed AND have attractive valuation).
如果您喜歡與管理層一起購買股票,那麼您可能會喜歡這個公司的免費列表。 (提示:其中許多公司不爲人注意且具有吸引力的估值。)
Please note, the market returns quoted in this article reflect the market weighted average returns of stocks that currently trade on American exchanges.
請注意,本文所引述的市場回報反映了目前在美國交易所上市的股票的市場加權平均回報。
Have feedback on this article? Concerned about the content? Get in touch with us directly. Alternatively, email editorial-team (at) simplywallst.com.
This article by Simply Wall St is general in nature. We provide commentary based on historical data and analyst forecasts only using an unbiased methodology and our articles are not intended to be financial advice. It does not constitute a recommendation to buy or sell any stock, and does not take account of your objectives, or your financial situation. We aim to bring you long-term focused analysis driven by fundamental data. Note that our analysis may not factor in the latest price-sensitive company announcements or qualitative material. Simply Wall St has no position in any stocks mentioned.
對本文有任何反饋?對內容有任何疑慮?請直接與我們聯繫。或者,發送電子郵件至editorial-team@simplywallst.com。
這篇文章是Simply Wall St的一般性文章。我們根據歷史數據和分析師預測提供評論,只使用公正的方法論,我們的文章並不意味着提供任何金融建議。文章不構成買賣任何股票的建議,也不考慮您的目標或您的財務狀況。我們的目標是帶給您基本數據驅動的長期關注分析。請注意,我們的分析可能不考慮最新的價格敏感公司公告或定性材料。Simply Wall St沒有任何股票頭寸。
譯文內容由第三人軟體翻譯。