
Philip Morris International (NYSE:PM) Sheds 4.1% This Week, as Yearly Returns Fall More in Line With Earnings Growth
Philip Morris International (NYSE:PM) Sheds 4.1% This Week, as Yearly Returns Fall More in Line With Earnings Growth
 Over half a decade, Philip Morris International managed to grow its earnings per share at 2.4% a year. This EPS growth is lower than the 10% average annual increase in the share price. This suggests that market participants hold the company in higher regard, these days. And that's hardly shocking given the track record of growth.
 If you buy and hold a stock for many years, you'd hope to be making a profit. Furthermore, you'd generally like to see the share price rise faster than the market. But Philip Morris International Inc. (NYSE:PM) has fallen short of that second goal, with a share price rise of 59% over five years, which is below the market return. But if you include dividends then the return is market-beating. Some buyers are laughing, though, with an increase of 29% in the last year.
如果您長揸一隻股票,希望能夠獲利。此外,您通常希望看到股價上漲速度快於市場。但菲利普莫里斯國際公司(紐交所:PM)未能實現第二個目標,股價在五年內上漲了59%,低於市場回報。但如果包括分紅,回報則超過市場。一些買家在過去一年中增長了29%,其中一些買家正在發笑。
While this past week has detracted from the company's five-year return, let's look at the recent trends of the underlying business and see if the gains have been in alignment.
雖然過去的一週削弱了公司的五年回報,但讓我們看看業務的最近趨勢,並查看收益是否已對齊。
While markets are a powerful pricing mechanism, share prices reflect investor sentiment, not just underlying business performance. One way to examine how market sentiment has changed over time is to look at the interaction between a company's share price and its earnings per share (EPS).
儘管市場是一個強大的價格機制,但股票價格反映的不僅是潛在業務績效,還反映了投資者的情緒。 了解市場情緒隨時間的變化的一種方法是查看公司的股價與每股收益(EPS)之間的互動。
Over half a decade, Philip Morris International managed to grow its earnings per share at 2.4% a year. This EPS growth is lower than the 10% average annual increase in the share price. This suggests that market participants hold the company in higher regard, these days. And that's hardly shocking given the track record of growth.
在半個多世紀的時間裏,菲利普莫里斯國際公司的每股收益以2.4%的年增長率增長。這種每股收益增長低於股價每年以10%的平均增長率增長。這表明市場參與者如今更看好這家公司。鑑於該公司的增長記錄,這並不奇怪。
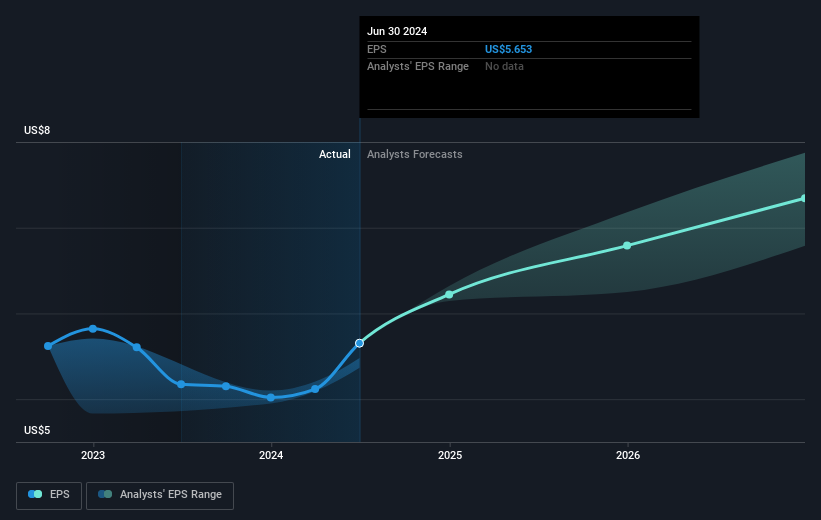
The company's earnings per share (over time) is depicted in the image below (click to see the exact numbers).
該公司的每股收益(隨時間的推移)如下圖所示(單擊可查看確切數字)。
Dive deeper into Philip Morris International's key metrics by checking this interactive graph of Philip Morris International's earnings, revenue and cash flow.
通過查看菲利普莫里斯國際股份有限公司的收益,營業收入和現金流的互動圖表,深入了解該公司的關鍵性能指標。
What About Dividends?
那麼分紅怎麼樣呢?
As well as measuring the share price return, investors should also consider the total shareholder return (TSR). The TSR incorporates the value of any spin-offs or discounted capital raisings, along with any dividends, based on the assumption that the dividends are reinvested. So for companies that pay a generous dividend, the TSR is often a lot higher than the share price return. In the case of Philip Morris International, it has a TSR of 107% for the last 5 years. That exceeds its share price return that we previously mentioned. This is largely a result of its dividend payments!
除了衡量股價回報外,投資者還應考慮總股東回報(TSR)。 TSR包括任何分拆或折讓的資本籌集價值,以及基於假設分紅再投資的任何股息價值。 因此,對於支付慷慨股息的公司,TSR通常比股價回報高得多。 菲利普莫里斯國際的情況下,過去5年的TSR爲107%。 這超過了我們先前提到的股價回報。 這在很大程度上是其股息支付的結果!
A Different Perspective
不同的觀點
We're pleased to report that Philip Morris International shareholders have received a total shareholder return of 36% over one year. Of course, that includes the dividend. Since the one-year TSR is better than the five-year TSR (the latter coming in at 16% per year), it would seem that the stock's performance has improved in recent times. Someone with an optimistic perspective could view the recent improvement in TSR as indicating that the business itself is getting better with time. It's always interesting to track share price performance over the longer term. But to understand Philip Morris International better, we need to consider many other factors. Even so, be aware that Philip Morris International is showing 3 warning signs in our investment analysis , you should know about...
我們很高興地報告,菲利普莫里斯國際股東在過去一年內獲得了36%的總股東回報。 當然,這包括了股息。 由於一年的TSR優於五年的TSR(後者每年爲16%),似乎該股票的表現近年來有所改善。 樂觀的人士可能會認爲TSR的最近改善表明該業務本身隨着時間而變得更好。 跟蹤股價表現長期來看總是很有趣。 但要更好地了解菲利普莫里斯國際,我們需要考慮許多其他因素。 即便如此,請注意,菲利普莫里斯國際在我們的投資分析中顯示出3個警示信號,您應該知道...
If you are like me, then you will not want to miss this free list of undervalued small caps that insiders are buying.
如果您像我一樣,就不會希望錯過這份免費的內部人士正在購買的低估小市值股票列表。
Please note, the market returns quoted in this article reflect the market weighted average returns of stocks that currently trade on American exchanges.
請注意,本文所引述的市場回報反映了目前在美國交易所上市的股票的市場加權平均回報。
Have feedback on this article? Concerned about the content? Get in touch with us directly. Alternatively, email editorial-team (at) simplywallst.com.
This article by Simply Wall St is general in nature. We provide commentary based on historical data and analyst forecasts only using an unbiased methodology and our articles are not intended to be financial advice. It does not constitute a recommendation to buy or sell any stock, and does not take account of your objectives, or your financial situation. We aim to bring you long-term focused analysis driven by fundamental data. Note that our analysis may not factor in the latest price-sensitive company announcements or qualitative material. Simply Wall St has no position in any stocks mentioned.
對本文有任何反饋?對內容有任何疑慮?請直接與我們聯繫。或者,發送電子郵件至editorial-team@simplywallst.com。
這篇文章是Simply Wall St的一般性文章。我們根據歷史數據和分析師預測提供評論,只使用公正的方法論,我們的文章並不意味着提供任何金融建議。文章不構成買賣任何股票的建議,也不考慮您的目標或您的財務狀況。我們的目標是帶給您基本數據驅動的長期關注分析。請注意,我們的分析可能不考慮最新的價格敏感公司公告或定性材料。Simply Wall St沒有任何股票頭寸。
譯文內容由第三人軟體翻譯。