
There's Been No Shortage Of Growth Recently For Harmonic's (NASDAQ:HLIT) Returns On Capital
There's Been No Shortage Of Growth Recently For Harmonic's (NASDAQ:HLIT) Returns On Capital
 0.011 = US$6.0m ÷ (US$714m - US$152m)
 There are a few key trends to look for if we want to identify the next multi-bagger. One common approach is to try and find a company with returns on capital employed (ROCE) that are increasing, in conjunction with a growing amount of capital employed. If you see this, it typically means it's a company with a great business model and plenty of profitable reinvestment opportunities. With that in mind, we've noticed some promising trends at Harmonic (NASDAQ:HLIT) so let's look a bit deeper.
如果我們想找到下一個多倍賺錢的股票,需要留意一些關鍵趨勢。一種常見的方法是嘗試找到一個資本回報率(ROCE)增長並且資本投入增加的公司。如果你看到這一點,通常意味着這是一傢俱有良好商業模式和豐富盈利再投資機會的公司。考慮到這一點,我們注意到了諧波(納斯達克:HLIT)一些有前途的趨勢,讓我們深入了解一下。
Return On Capital Employed (ROCE): What Is It?
資本僱用回報率(ROCE)是什麼?
If you haven't worked with ROCE before, it measures the 'return' (pre-tax profit) a company generates from capital employed in its business. To calculate this metric for Harmonic, this is the formula:
如果你之前沒有接觸過ROCE,那它測量的是公司從其業務中投入的資本中實現的「回報」(稅前利潤)。“計算諧波這個指標,公式如下:
Return on Capital Employed = Earnings Before Interest and Tax (EBIT) ÷ (Total Assets - Current Liabilities)
資產僱用回報率(ROCE)是指企業利潤,即企業稅前利潤除以企業投入的總資本(負債加股權)。如果ROCE高於企業財務成本的承受能力,那麼企業就會創造出更多的價值。
0.011 = US$6.0m ÷ (US$714m - US$152m) (Based on the trailing twelve months to June 2024).
0.011 = 600萬美元 ÷ (71400萬美元 - 152萬美元)(基於2024年6月的過去12個月)。
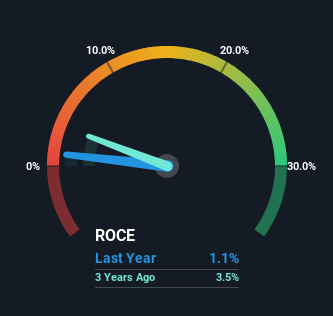
So, Harmonic has an ROCE of 1.1%. In absolute terms, that's a low return and it also under-performs the Communications industry average of 9.6%.
因此,諧波的資本回報率爲1.1%。從絕對值來看,這是一個較低的回報率,也低於通信-半導體行業平均水平9.6%。
In the above chart we have measured Harmonic's prior ROCE against its prior performance, but the future is arguably more important. If you'd like to see what analysts are forecasting going forward, you should check out our free analyst report for Harmonic .
在上面的圖表中,我們測量了諧波的先前資本回報率與其先前表現,但未來可以說更重要。如果您想了解分析師對未來的預測,您可以查看我們提供的諧波免費分析師報告。
What Can We Tell From Harmonic's ROCE Trend?
從諧波的資本回報率趨勢中我們能夠得出什麼結論?
The fact that Harmonic is now generating some pre-tax profits from its prior investments is very encouraging. Shareholders would no doubt be pleased with this because the business was loss-making five years ago but is is now generating 1.1% on its capital. And unsurprisingly, like most companies trying to break into the black, Harmonic is utilizing 45% more capital than it was five years ago. This can tell us that the company has plenty of reinvestment opportunities that are able to generate higher returns.
諧波現在從其先前的投資中產生一些稅前利潤的事實非常令人鼓舞。股東毫無疑問會對此感到高興,因爲該業務在五年前還在虧損,但現在在其資本上獲得1.1%的收益。毫無疑問,像大多數試圖扭虧爲盈的公司一樣,諧波現在比五年前多利用45%的資本。這告訴我們公司有很多可以產生更高回報的再投資機會。
Our Take On Harmonic's ROCE
我們對諧波的ROCE的看法
Overall, Harmonic gets a big tick from us thanks in most part to the fact that it is now profitable and is reinvesting in its business. Since the stock has returned a staggering 110% to shareholders over the last five years, it looks like investors are recognizing these changes. So given the stock has proven it has promising trends, it's worth researching the company further to see if these trends are likely to persist.
總的來說,諧波得到了我們的高度認可,這在很大程度上要歸功於它現在盈利並正在對其業務進行再投資。由於該股票在過去五年爲股東帶來了驚人的110%回報,看起來投資者正在認識到這些變化。因此,考慮到股票已經證明具有有前途的趨勢,值得進一步研究該公司,以查看這些趨勢是否可能持續。
If you'd like to know about the risks facing Harmonic, we've discovered 3 warning signs that you should be aware of.
如果您想了解諧波面臨的風險,我們發現了3個警示信號,您應該注意。
For those who like to invest in solid companies, check out this free list of companies with solid balance sheets and high returns on equity.
Hao Tian International Construction Investment Group確實存在一些風險,我們已經發現了一條警示標誌,你可能會感興趣。對於那些喜歡投資於實力雄厚的公司的人,可以查看這個由財務狀況強大、股本回報率高的公司組成的免費列表。
Have feedback on this article? Concerned about the content? Get in touch with us directly. Alternatively, email editorial-team (at) simplywallst.com.
This article by Simply Wall St is general in nature. We provide commentary based on historical data and analyst forecasts only using an unbiased methodology and our articles are not intended to be financial advice. It does not constitute a recommendation to buy or sell any stock, and does not take account of your objectives, or your financial situation. We aim to bring you long-term focused analysis driven by fundamental data. Note that our analysis may not factor in the latest price-sensitive company announcements or qualitative material. Simply Wall St has no position in any stocks mentioned.
對本文有任何反饋?對內容有任何疑慮?請直接與我們聯繫。或者,發送電子郵件至editorial-team@simplywallst.com。
這篇文章是Simply Wall St的一般性文章。我們根據歷史數據和分析師預測提供評論,只使用公正的方法論,我們的文章並不意味着提供任何金融建議。文章不構成買賣任何股票的建議,也不考慮您的目標或您的財務狀況。我們的目標是帶給您基本數據驅動的長期關注分析。請注意,我們的分析可能不考慮最新的價格敏感公司公告或定性材料。Simply Wall St沒有任何股票頭寸。
譯文內容由第三人軟體翻譯。