
Inquiry Into Oracle's Competitor Dynamics In Software Industry
Inquiry Into Oracle's Competitor Dynamics In Software Industry
 The Price to Earnings ratio of
 In today's rapidly evolving and fiercely competitive business landscape, it is crucial for investors and industry analysts to conduct comprehensive company evaluations. In this article, we will undertake an in-depth industry comparison, assessing Oracle (NYSE:ORCL) alongside its primary competitors in the Software industry. By meticulously examining crucial financial indicators, market positioning, and growth potential, we aim to provide valuable insights to investors and shed light on company's performance within the industry.
在當今日新月異的激烈競爭的商業環境中,投資者和行業分析師需要進行全面的公司評估至關重要。在本文中,我們將進行深入的行業比較,評估甲骨文(紐交所:ORCL)與軟件行業的主要競爭對手。通過精心檢驗關鍵的財務指標、市場定位和增長潛力,我們旨在爲投資者提供有價值的見解,並揭示公司在行業內的業績。
Oracle Background
甲骨文背景
Oracle provides database technology and enterprise resource planning, or ERP, software to enterprises around the world. Founded in 1977, Oracle pioneered the first commercial SQL-based relational database management system. Today, Oracle has 430,000 customers in 175 countries, supported by its base of 136,000 employees.
Oracle向全球企業提供數據庫技術和企業資源規劃(ERP)軟件。Oracle成立於1977年,是第一個商用SQL數據庫管理系統的創始人。如今,Oracle在175個國家擁有430,000個客戶,由136,000名員工支持。
| Company | P/E | P/B | P/S | ROE | EBITDA (in billions) | Gross Profit (in billions) | Revenue Growth |
|---|---|---|---|---|---|---|---|
| Oracle Corp | 43.19 | 42.94 | 8.81 | 30.01% | $5.44 | $9.4 | 6.86% |
| Microsoft Corp | 37.17 | 12.14 | 13.36 | 8.45% | $34.33 | $45.04 | 15.2% |
| ServiceNow Inc | 166.53 | 21.84 | 19.13 | 3.12% | $0.48 | $2.08 | 22.19% |
| Palo Alto Networks Inc | 45.82 | 21.01 | 14.71 | 7.42% | $0.39 | $1.62 | 12.09% |
| CrowdStrike Holdings Inc | 401.83 | 23.82 | 19.58 | 1.75% | $0.12 | $0.73 | 31.74% |
| Fortinet Inc | 44.77 | 200.81 | 10.60 | 504.05% | $0.5 | $1.16 | 10.95% |
| Gen Digital Inc | 27.98 | 8.39 | 4.47 | 8.69% | $0.54 | $0.78 | 2.33% |
| Monday.Com Ltd | 334.34 | 15.02 | 16.35 | 1.62% | $0.0 | $0.21 | 34.4% |
| Dolby Laboratories Inc | 33.31 | 2.85 | 5.63 | 1.58% | $0.06 | $0.25 | -3.2% |
| CommVault Systems Inc | 39.49 | 23.77 | 7.98 | 6.62% | $0.02 | $0.18 | 13.38% |
| Qualys Inc | 27.22 | 10.61 | 7.98 | 10.52% | $0.05 | $0.12 | 8.38% |
| Teradata Corp | 45.45 | 37.27 | 1.62 | 57.36% | $0.09 | $0.27 | -5.63% |
| Progress Software Corp | 35.37 | 6.14 | 3.62 | 3.75% | $0.05 | $0.14 | -1.78% |
| N-able Inc | 72.28 | 3.33 | 5.43 | 1.32% | $0.03 | $0.1 | 12.6% |
| SolarWinds Corp | 106.92 | 1.67 | 2.80 | 0.86% | $0.07 | $0.17 | 4.44% |
| Average | 101.32 | 27.76 | 9.52 | 44.08% | $2.62 | $3.77 | 11.22% |
| 公司 | 市銷率P/S | 淨資產收益率ROE | 息稅前收入EBITDA (以十億計) | 毛利潤 (以十億計) | 營收增長 | CrowdStrike Holdings Inc (847.84) | 營業收入增長 |
|---|---|---|---|---|---|---|---|
| 甲骨文公司 | 43.19 | 42.94 | 8.81 | 30.01% | $5.44 | 9.4美元 | 6.86% |
| 微軟公司 | 37.17 | 13.36 | 8.45% | $34.33 | $45.04 | 15.2% | |
| ServiceNow公司 | 166.53 | 21.84 | 19.13 | 3.12% | 0.48美元 | $2.08 | 22.19% |
| Palo Alto Networks公司 | 45.82 | 21.01 | 14.71 | 7.42% | 0.39美元 | $1.62 | 12.09% |
| CrowdStrike控股公司 | 401.83 | 23.82 | 其他應收款5. 其他應收款截至2023年6月30日餘額是$5.74。 | 1.75% | $0.12 | 0.73美元 | 31.74% |
| Fortinet Inc | 44.77 | 200.81 | 10.60 | 504.05% | $0.5 | $1.16 | 10.95% |
| Gen Digital Inc | 27.98 | 8.39 | 4.47 | 8.69% | $0.54 | $0.78 | 2.33% |
| Monday.Com Ltd | 334.34 | 15.02 | 16.35 | 1.62% | $0.0 | 0.21美元 | 34.4% |
| 杜比實驗室股份有限公司 | 33.31 | 2.85 | 5.63 | 1.58% | 0.06美元 | $0.25 | -3.2% |
| CommVault Systems公司 | 39.49 | 23.77 | 7.98 | 6.62% | $0.02 | 0.18美元 | 13.38% |
| Qualys公司 | 27.22 | 10.61 | 7.98 | 10.52% | $0.05 | $0.12 | 8.38% |
| 天睿公司 | 45.45 | 37.27 | 1.62 | 57.36% | $0.09 | $0.27 | -5.63% |
| Progress Software公司 | 35.37 | 6.14 | 3.62 | 3.75% | $0.05 | 0.14美元 | -1.78% |
| N-able公司 | 72.28 | 3.33 | 5.43 | 1.32% | 0.03美元 | 0.1美元 | 12.6% |
| SolarWinds公司 | 106.92 | 1.67 | 2.80 | 0.86% | 0.07美元 | 0.17美元 | 4.44% |
| 平均值 | 101.32 | 27.76 | 9.52 | 44.08% | $2.62 | $3.77 | 11.22% |
By conducting an in-depth analysis of Oracle, we can identify the following trends:
通過對Oracle進行深入分析,我們可以確定以下趨勢:
The Price to Earnings ratio of 43.19 is 0.43x lower than the industry average, indicating potential undervaluation for the stock.
The elevated Price to Book ratio of 42.94 relative to the industry average by 1.55x suggests company might be overvalued based on its book value.
The Price to Sales ratio is 8.81, which is 0.93x the industry average. This suggests a possible undervaluation based on sales performance.
The Return on Equity (ROE) of 30.01% is 14.07% below the industry average, suggesting potential inefficiency in utilizing equity to generate profits.
The Earnings Before Interest, Taxes, Depreciation, and Amortization (EBITDA) of $5.44 Billion is 2.08x above the industry average, highlighting stronger profitability and robust cash flow generation.
With higher gross profit of $9.4 Billion, which indicates 2.49x above the industry average, the company demonstrates stronger profitability and higher earnings from its core operations.
The company is witnessing a substantial decline in revenue growth, with a rate of 6.86% compared to the industry average of 11.22%, which indicates a challenging sales environment.
43.19的市盈率比行業平均水平低0.43倍,表明股票可能被低估。
42.94的市淨率相對於行業平均水平高1.55倍,表明公司可能被高估。
銷售市銷率爲8.81,比行業平均水平高0.93倍。這表明可能存在基於銷售業績的低估情況。
30.01%的股東權益報酬率(ROE)比行業平均水平低14.07%,表明可能存在使用股東權益不效率的情況。
企業的息稅折舊攤銷前利潤(EBITDA)達到54.4億美元,高出行業平均水平2.08倍,彰顯更強的盈利能力和強勁的現金流產生能力。
由於更高的毛利潤達到94億美元,超過行業平均水平2.49倍,該公司展示了更強的盈利能力和更高的核心業務收益。
該公司的營業收入增長出現大幅下滑,增速爲6.86%,相比行業平均水平的11.22%,表明銷售環境面臨挑戰。
Debt To Equity Ratio
債務權益比率
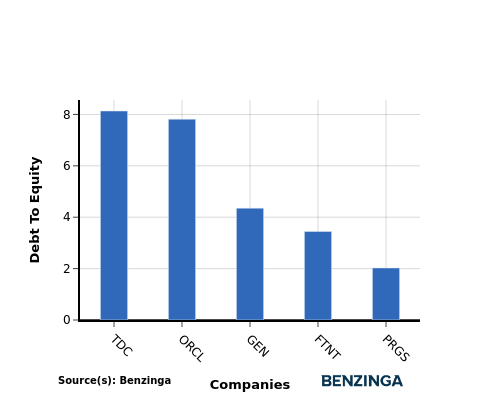
The debt-to-equity (D/E) ratio helps evaluate the capital structure and financial leverage of a company.
債務權益比率有助於評估公司的資本結構和財務槓桿。
Considering the debt-to-equity ratio in industry comparisons allows for a concise evaluation of a company's financial health and risk profile, aiding in informed decision-making.
在行業比較中考慮債務權益比率可以簡明地評估公司的財務狀況和風險特徵,有助於投資者做出明智的決策。
By considering the Debt-to-Equity ratio, Oracle can be compared to its top 4 peers, leading to the following observations:
通過考慮債務與股權比率,Oracle可以與其排名前4位的同行公司進行比較,得出以下觀察結果:
Among its top 4 peers, Oracle is placed in the middle with a moderate debt-to-equity ratio of 7.81.
This implies a balanced financial structure, with a reasonable proportion of debt and equity.
在其前4名競爭對手中,Oracle處於中間位置,債務-股本比率爲7.81,屬於中等水平。
這意味着一個平衡的財務結構,債務和股本的比例合理。
Key Takeaways
要點
For Oracle in the Software industry, the PE ratio is low compared to peers, indicating potential undervaluation. The PB ratio is high, suggesting investors are willing to pay a premium for its assets. The PS ratio is low, signaling a possible undervaluation based on revenue. In terms of ROE, Oracle is performing below industry average, while its high EBITDA and gross profit indicate strong operational performance. The low revenue growth may raise concerns about future prospects compared to industry peers.
對於軟件行業的Oracle來說,市盈率相對較低,表明可能被低估。市淨率較高,說明投資者願意爲其資產支付溢價。市銷率較低,表明基於營業收入的估值可能被低估。在ROE方面,Oracle的表現低於行業平均水平,而其較高的EBITDA和毛利潤表明其運營績效強勁。營業收入增長較低可能引發對未來前景的擔憂,與行業同行相比。
This article was generated by Benzinga's automated content engine and reviewed by an editor.
本文由Benzinga的自動化內容引擎生成並由編輯審查。
譯文內容由第三人軟體翻譯。