
Is Ocular Therapeutix (NASDAQ:OCUL) Weighed On By Its Debt Load?
Is Ocular Therapeutix (NASDAQ:OCUL) Weighed On By Its Debt Load?
 According to the last reported balance sheet, Ocular Therapeutix had liabilities of US$30.0m due within 12 months, and liabilities of US$109.4m due beyond 12 months. Offsetting these obligations, it had cash of US$459.7m as well as receivables valued at US$30.2m due within 12 months. So it actually has US$350.5m
 Some say volatility, rather than debt, is the best way to think about risk as an investor, but Warren Buffett famously said that 'Volatility is far from synonymous with risk.' So it seems the smart money knows that debt - which is usually involved in bankruptcies - is a very important factor, when you assess how risky a company is. Importantly, Ocular Therapeutix, Inc. (NASDAQ:OCUL) does carry debt. But the real question is whether this debt is making the company risky.
有人說,投資者思考風險的最佳方式是波動性而不是債務,但禾倫·巴菲特曾經說過'波動性與風險遠非同義詞.' 因此,聰明的投資者知道,債務(通常與破產有關)是評估一家公司風險性的一個非常重要因素。值得注意的是,Ocular Therapeutix, Inc.(納斯達克:OCUL)的確存在債務。但真正的問題是,這筆債務是否讓公司變得風險更高。
When Is Debt A Problem?
什麼時候負債才是一個問題?
Debt and other liabilities become risky for a business when it cannot easily fulfill those obligations, either with free cash flow or by raising capital at an attractive price. In the worst case scenario, a company can go bankrupt if it cannot pay its creditors. While that is not too common, we often do see indebted companies permanently diluting shareholders because lenders force them to raise capital at a distressed price. Of course, plenty of companies use debt to fund growth, without any negative consequences. When we examine debt levels, we first consider both cash and debt levels, together.
當企業不能輕鬆地通過自由現金流或以有吸引力的價格籌集資金來履行債務時,債務和其他負債對企業變得高風險。在最壞的情況下,如果企業不能償還債權人,它可能會破產。雖然這並不太常見,但我們經常看到負債公司因貸款人強迫其以低價籌資而永久稀釋股東。當我們審查債務水平時,我們首先考慮現金和債務水平。
What Is Ocular Therapeutix's Net Debt?
Ocular Therapeutix的淨債務是多少?
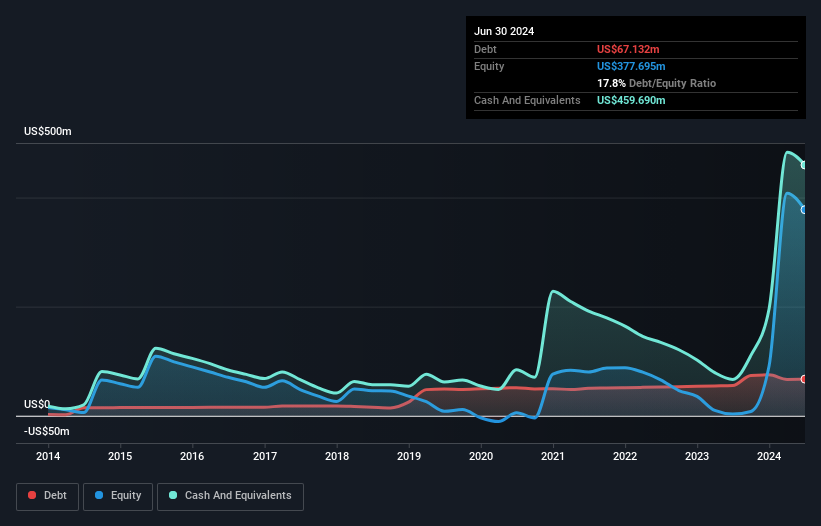
You can click the graphic below for the historical numbers, but it shows that as of June 2024 Ocular Therapeutix had US$67.1m of debt, an increase on US$55.4m, over one year. However, its balance sheet shows it holds US$459.7m in cash, so it actually has US$392.6m net cash.
您可以點擊下方的圖表查看歷史數據,但數據顯示截至2024年6月,Ocular Therapeutix的債務爲6710萬美元,較一年前的5540萬美元有所增加。然而,其資產負債表顯示該公司持有45970萬美元現金,因此實際上淨現金爲39260萬美元。
How Healthy Is Ocular Therapeutix's Balance Sheet?
oculatherapeutix的資產負債表有多健康?
According to the last reported balance sheet, Ocular Therapeutix had liabilities of US$30.0m due within 12 months, and liabilities of US$109.4m due beyond 12 months. Offsetting these obligations, it had cash of US$459.7m as well as receivables valued at US$30.2m due within 12 months. So it actually has US$350.5m more liquid assets than total liabilities.
根據最近報告的資產負債表,oculatherapeutix在12個月內到期的負債爲3億美元,而在12個月後到期的負債爲109.4億美元。 抵消這些義務,它手頭有4.597億美元的現金,以及價值3.02億美元的應收款項在12個月內到期。 所以它實際上比總負債多3.505億美元的流動資產。
It's good to see that Ocular Therapeutix has plenty of liquidity on its balance sheet, suggesting conservative management of liabilities. Because it has plenty of assets, it is unlikely to have trouble with its lenders. Simply put, the fact that Ocular Therapeutix has more cash than debt is arguably a good indication that it can manage its debt safely. When analysing debt levels, the balance sheet is the obvious place to start. But it is future earnings, more than anything, that will determine Ocular Therapeutix's ability to maintain a healthy balance sheet going forward. So if you're focused on the future you can check out this free report showing analyst profit forecasts.
看到oculatherapeutix在財務報表上有大量流動性是好事,表明其保守管理負債。 由於擁有大量資產,它不太可能與貸款人發生麻煩。 簡單地說,oculatherapeutix擁有比債務多的現金可能是其安全管理債務的良好跡象。 分析債務水平時,資產負債表是顯而易見的起點。 但更重要的是,未來的盈利將決定oculatherapeutix維持健康資產負債表的能力。 所以如果你對未來感興趣,可以查看這份顯示分析師盈利預測的免費報告。
Over 12 months, Ocular Therapeutix reported revenue of US$61m, which is a gain of 12%, although it did not report any earnings before interest and tax. That rate of growth is a bit slow for our taste, but it takes all types to make a world.
在過去12個月中,oculatherapeutix報告的營業收入爲6100萬美元,增長了12%,儘管它沒有報告任何利息和稅前盈利。 這種增長速度對我們的口味略顯緩慢,但世界需要各種各樣的公司。
So How Risky Is Ocular Therapeutix?
那麼,oculatherapeutix有多大風險?
By their very nature companies that are losing money are more risky than those with a long history of profitability. And the fact is that over the last twelve months Ocular Therapeutix lost money at the earnings before interest and tax (EBIT) line. And over the same period it saw negative free cash outflow of US$91m and booked a US$138m accounting loss. While this does make the company a bit risky, it's important to remember it has net cash of US$392.6m. That means it could keep spending at its current rate for more than two years. Overall, its balance sheet doesn't seem overly risky, at the moment, but we're always cautious until we see the positive free cash flow. When analysing debt levels, the balance sheet is the obvious place to start. But ultimately, every company can contain risks that exist outside of the balance sheet. To that end, you should learn about the 3 warning signs we've spotted with Ocular Therapeutix (including 1 which shouldn't be ignored) .
從本質上講,虧損的公司比那些長期盈利的公司更具風險性。 事實是,在過去的12個月中,oculatherapeutix在利息和稅前盈利(EBIT)方面虧損,並且在同期內看到自由現金流流出9100萬美元,並計入了1380萬美元的會計損失。 儘管這使公司有些風險,但重要的是記住它淨現金3926萬美元。 這意味着它可以以目前的速度繼續支出超過兩年。 總的來說,其資產負債表目前似乎並不過於冒險,但在看到正面的自由現金流之前,我們總是保持謹慎。 分析債務水平時,資產負債表是顯而易見的起點。 但最終,每家公司都可能存在超出資產負債表之外的風險。 因此,你應該了解我們發現的oculatherapeutix的3個警示信號(包括您不應忽視的1個)。
When all is said and done, sometimes its easier to focus on companies that don't even need debt. Readers can access a list of growth stocks with zero net debt 100% free, right now.
說到底,有時候更容易集中精力關注根本不需要債務的公司。讀者可以免費訪問零淨債務增長股票列表。
Have feedback on this article? Concerned about the content? Get in touch with us directly. Alternatively, email editorial-team (at) simplywallst.com.
This article by Simply Wall St is general in nature. We provide commentary based on historical data and analyst forecasts only using an unbiased methodology and our articles are not intended to be financial advice. It does not constitute a recommendation to buy or sell any stock, and does not take account of your objectives, or your financial situation. We aim to bring you long-term focused analysis driven by fundamental data. Note that our analysis may not factor in the latest price-sensitive company announcements or qualitative material. Simply Wall St has no position in any stocks mentioned.
對本文有任何反饋?對內容有任何疑慮?請直接與我們聯繫。或者,發送電子郵件至editorial-team@simplywallst.com。
這篇文章是Simply Wall St的一般性文章。我們根據歷史數據和分析師預測提供評論,只使用公正的方法論,我們的文章並不意味着提供任何金融建議。文章不構成買賣任何股票的建議,也不考慮您的目標或您的財務狀況。我們的目標是帶給您基本數據驅動的長期關注分析。請注意,我們的分析可能不考慮最新的價格敏感公司公告或定性材料。Simply Wall St沒有任何股票頭寸。
譯文內容由第三人軟體翻譯。
