
Willdan Group's (NASDAQ:WLDN) 1,805% YoY Earnings Expansion Surpassed the Shareholder Returns Over the Past Year
Willdan Group's (NASDAQ:WLDN) 1,805% YoY Earnings Expansion Surpassed the Shareholder Returns Over the Past Year
 During the last year Willdan Group saw its earnings per share (EPS) increase strongly. This remarkable growth rate may not be sustainable, but it is still impressive. So we're unsurprised to see the share price gaining ground. To us, inflection points like this are the best time to take a close look at a stock.
 Unfortunately, investing is risky - companies can and do go bankrupt. But if you pick the right business to buy shares in, you can make more than you can lose. For example, the Willdan Group, Inc. (NASDAQ:WLDN) share price has soared 102% return in just a single year. It's also good to see the share price up 45% over the last quarter. However, the longer term returns haven't been so impressive, with the stock up just 22% in the last three years.
很抱歉,投資是有風險的-公司可能破產。但是,如果你選擇了正確的業務買入股票,你可以賺得比虧得更多。例如,Willdan集團股票(納斯達克代碼:WLDN)的股價在短短一年內飆升了102%。近一個季度,股價上漲了45%,也是一件好事。然而,從長期來看,投資回報並不那麼可觀,過去三年股票只上漲了22%。
On the back of a solid 7-day performance, let's check what role the company's fundamentals have played in driving long term shareholder returns.
在穩定的七天表現之後,讓我們看看公司的基本面對長期股東回報的影響。
In his essay The Superinvestors of Graham-and-Doddsville Warren Buffett described how share prices do not always rationally reflect the value of a business. By comparing earnings per share (EPS) and share price changes over time, we can get a feel for how investor attitudes to a company have morphed over time.
禾倫·巴菲特在他的論文《格雷厄姆-道德斯維爾的超級投資者》中描述了股票價格並不總是合理地反映企業的價值。通過比較每股收益(EPS)和股價隨時間變化的變化,我們可以了解到投資者對某家公司的態度如何隨時間而變化。
During the last year Willdan Group saw its earnings per share (EPS) increase strongly. This remarkable growth rate may not be sustainable, but it is still impressive. So we're unsurprised to see the share price gaining ground. To us, inflection points like this are the best time to take a close look at a stock.
在過去一年中,Willdan集團的每股收益(EPS)大幅增長。這種顯著的增長速度可能無法持續,但仍然令人印象深刻。所以我們並不奇怪看到股價上揚。對我們來說,這樣的轉折點是仔細觀察股票的最佳時機。
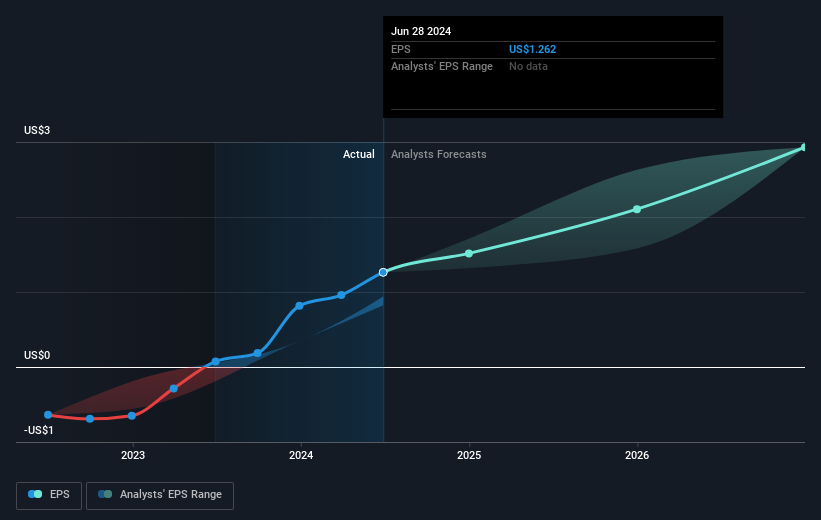
The graphic below depicts how EPS has changed over time (unveil the exact values by clicking on the image).
下圖顯示了EPS隨時間變化的情況(點擊圖像以顯示確切值)。
We're pleased to report that the CEO is remunerated more modestly than most CEOs at similarly capitalized companies. It's always worth keeping an eye on CEO pay, but a more important question is whether the company will grow earnings throughout the years. It might be well worthwhile taking a look at our free report on Willdan Group's earnings, revenue and cash flow.
我們很高興地報告,CEO的薪酬比大多數同類資本企業的CEO都要適度。關注CEO的薪酬總是值得的,但更重要的問題是公司在以後是否會增長收益。查看Willdan集團的收益、營業收入和現金流的免費報告可能非常值得一試。
A Different Perspective
不同的觀點
It's good to see that Willdan Group has rewarded shareholders with a total shareholder return of 102% in the last twelve months. Since the one-year TSR is better than the five-year TSR (the latter coming in at 3% per year), it would seem that the stock's performance has improved in recent times. In the best case scenario, this may hint at some real business momentum, implying that now could be a great time to delve deeper. While it is well worth considering the different impacts that market conditions can have on the share price, there are other factors that are even more important. For instance, we've identified 1 warning sign for Willdan Group that you should be aware of.
很高興看到Willdan集團在過去12個月獎勵股東,股東總回報率達到102%。由於一年的TSR比五年的TSR要好(後者每年爲3%),似乎股票的表現在最近時間有所改善。在最好的情況下,這可能暗示着真正的業務勢頭,這意味着現在可能是深入了解的好時機。雖然值得考慮市場條件對股價的不同影響,但還有其他更重要的因素。例如,我們已經發現Willdan集團存在1個警示信號,您應該注意。
Of course, you might find a fantastic investment by looking elsewhere. So take a peek at this free list of companies we expect will grow earnings.
當然,您可能在其他地方找到一家出色的企業進行投資。因此,請查看我們預計將實現盈利增長的公司的免費列表。
Please note, the market returns quoted in this article reflect the market weighted average returns of stocks that currently trade on American exchanges.
請注意,本文所引述的市場回報反映了目前在美國交易所上市的股票的市場加權平均回報。
Have feedback on this article? Concerned about the content? Get in touch with us directly. Alternatively, email editorial-team (at) simplywallst.com.
This article by Simply Wall St is general in nature. We provide commentary based on historical data and analyst forecasts only using an unbiased methodology and our articles are not intended to be financial advice. It does not constitute a recommendation to buy or sell any stock, and does not take account of your objectives, or your financial situation. We aim to bring you long-term focused analysis driven by fundamental data. Note that our analysis may not factor in the latest price-sensitive company announcements or qualitative material. Simply Wall St has no position in any stocks mentioned.
對本文有任何反饋?對內容有任何疑慮?請直接與我們聯繫。或者,發送電子郵件至editorial-team@simplywallst.com。
這篇文章是Simply Wall St的一般性文章。我們根據歷史數據和分析師預測提供評論,只使用公正的方法論,我們的文章並不意味着提供任何金融建議。文章不構成買賣任何股票的建議,也不考慮您的目標或您的財務狀況。我們的目標是帶給您基本數據驅動的長期關注分析。請注意,我們的分析可能不考慮最新的價格敏感公司公告或定性材料。Simply Wall St沒有任何股票頭寸。
譯文內容由第三人軟體翻譯。
