
Brookline Bancorp (NASDAQ:BRKL) Earnings and Shareholder Returns Have Been Trending Downwards for the Last Five Years, but the Stock Increases 6.7% This Past Week
Brookline Bancorp (NASDAQ:BRKL) Earnings and Shareholder Returns Have Been Trending Downwards for the Last Five Years, but the Stock Increases 6.7% This Past Week
 Looking back five years, both Brookline Bancorp's share price and EPS declined; the latter at a rate of 4.4% per year. This reduction in EPS is less than the 7% annual reduction in the share price. So it seems the market was too confident about the business, in the past.
 Brookline Bancorp, Inc. (NASDAQ:BRKL) shareholders should be happy to see the share price up 28% in the last quarter. But if you look at the last five years the returns have not been good. You would have done a lot better buying an index fund, since the stock has dropped 29% in that half decade.
布魯克賴恩銀行股東應該對股價在上個季度上漲28%感到滿意。但是,如果您看過去五年的表現,回報並不好。您買入納斯達克指數基金會比買入該股票表現更好,因爲在過去的五年中該股下跌了29%。
On a more encouraging note the company has added US$59m to its market cap in just the last 7 days, so let's see if we can determine what's driven the five-year loss for shareholders.
更令人鼓舞的是,該公司在過去7天裏增加了5900萬美元的市值,因此讓我們看看是什麼導致股東承受了長達五年的損失。
There is no denying that markets are sometimes efficient, but prices do not always reflect underlying business performance. One way to examine how market sentiment has changed over time is to look at the interaction between a company's share price and its earnings per share (EPS).
市場有時無疑是高效的,但價格並不總是反映基礎業務表現。 一種檢查市場情緒如何隨時間改變的方法是查看公司的股價與每股收益(EPS)之間的互動。
Looking back five years, both Brookline Bancorp's share price and EPS declined; the latter at a rate of 4.4% per year. This reduction in EPS is less than the 7% annual reduction in the share price. So it seems the market was too confident about the business, in the past.
回顧過去五年,布魯克賴恩銀行的股價和每股收益都有下降,每股收益的下降速度爲4.4%。每股收益的下降幅度小於股價每年下降7%的幅度。因此,似乎市場過去對該企業過於自信了。
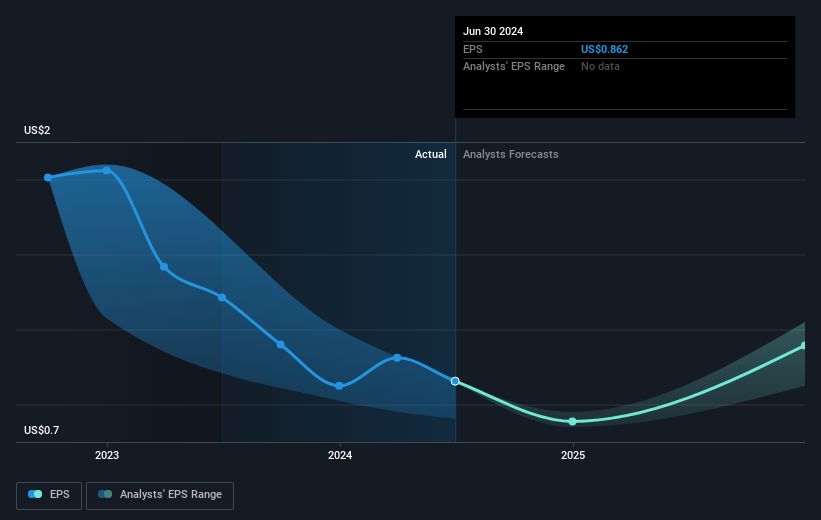
The graphic below depicts how EPS has changed over time (unveil the exact values by clicking on the image).
下圖顯示了EPS隨時間變化的情況(點擊圖像以顯示確切值)。
Before buying or selling a stock, we always recommend a close examination of historic growth trends, available here.
在購買或出售股票之前,我們始終建議對歷史增長趨勢進行仔細研究,可以在這裏找到相關信息。
What About Dividends?
那麼分紅怎麼樣呢?
As well as measuring the share price return, investors should also consider the total shareholder return (TSR). The TSR is a return calculation that accounts for the value of cash dividends (assuming that any dividend received was reinvested) and the calculated value of any discounted capital raisings and spin-offs. Arguably, the TSR gives a more comprehensive picture of the return generated by a stock. We note that for Brookline Bancorp the TSR over the last 5 years was -12%, which is better than the share price return mentioned above. This is largely a result of its dividend payments!
除了衡量股價回報外,投資者還應考慮總股東回報(TSR)。 TSR是一種回報計算,考慮了現金分紅的價值(假設已重新投資任何獲得的分紅)以及任何折現的資本增發和拆分的計算價值。可以說,TSR更全面地反映了股票產生的回報。我們注意到,對於布魯克賴恩銀行,過去5年的TSR爲-12%,優於上述股價回報。這在很大程度上是其分紅的結果!
A Different Perspective
不同的觀點
Brookline Bancorp shareholders gained a total return of 25% during the year. Unfortunately this falls short of the market return. But at least that's still a gain! Over five years the TSR has been a reduction of 2% per year, over five years. It could well be that the business is stabilizing. Most investors take the time to check the data on insider transactions. You can click here to see if insiders have been buying or selling.
布魯克賴恩銀行股東在該年度共獲得25%的總回報。不幸的是,這低於市場回報。但至少仍然是一個收益!在過去五年中,TSR每年減少2%,達到五年。業務可能正在穩定。大多數投資者花時間檢查內部交易數據。您可以 點擊這裏 查看內部人員是否一直在買入或賣出。
If you would prefer to check out another company -- one with potentially superior financials -- then do not miss this free list of companies that have proven they can grow earnings.
如果您願意查看另一家公司(具有潛在的更好財務狀況),請不要錯過這個免費的公司列表,證明它們可以增長收益。
Please note, the market returns quoted in this article reflect the market weighted average returns of stocks that currently trade on American exchanges.
請注意,本文所引述的市場回報反映了目前在美國交易所上市的股票的市場加權平均回報。
Have feedback on this article? Concerned about the content? Get in touch with us directly. Alternatively, email editorial-team (at) simplywallst.com.
This article by Simply Wall St is general in nature. We provide commentary based on historical data and analyst forecasts only using an unbiased methodology and our articles are not intended to be financial advice. It does not constitute a recommendation to buy or sell any stock, and does not take account of your objectives, or your financial situation. We aim to bring you long-term focused analysis driven by fundamental data. Note that our analysis may not factor in the latest price-sensitive company announcements or qualitative material. Simply Wall St has no position in any stocks mentioned.
對本文有任何反饋?對內容有任何疑慮?請直接與我們聯繫。或者,發送電子郵件至editorial-team@simplywallst.com。
這篇文章是Simply Wall St的一般性文章。我們根據歷史數據和分析師預測提供評論,只使用公正的方法論,我們的文章並不意味着提供任何金融建議。文章不構成買賣任何股票的建議,也不考慮您的目標或您的財務狀況。我們的目標是帶給您基本數據驅動的長期關注分析。請注意,我們的分析可能不考慮最新的價格敏感公司公告或定性材料。Simply Wall St沒有任何股票頭寸。
譯文內容由第三人軟體翻譯。
