
Despite the Downward Trend in Earnings at FinVolution Group (NYSE:FINV) the Stock Climbs 4.8%, Bringing Five-year Gains to 121%
Despite the Downward Trend in Earnings at FinVolution Group (NYSE:FINV) the Stock Climbs 4.8%, Bringing Five-year Gains to 121%
 During five years of share price growth, FinVolution Group actually saw its EPS drop 2.1% per year.
 When you buy and hold a stock for the long term, you definitely want it to provide a positive return. Better yet, you'd like to see the share price move up more than the market average. Unfortunately for shareholders, while the FinVolution Group (NYSE:FINV) share price is up 76% in the last five years, that's less than the market return. But if you include dividends then the return is market-beating. Over the last twelve months the stock price has risen a very respectable 7.5%.
當你買入並持有一隻股票進行長期投資時,你絕對希望它能提供正回報。更好的是,你希望看到股價上漲超過市場平均水平。不幸的是對股東來說,雖然FinVolution Group(紐交所:FINV)股價在過去五年內上漲了76%,但這低於市場回報。但如果包括分紅在內,那麼回報就超過了市場。過去十二個月股價上漲了非常可觀的7.5%。
The past week has proven to be lucrative for FinVolution Group investors, so let's see if fundamentals drove the company's five-year performance.
過去一週對FinVolution Group的投資者來說是賺錢的,現在讓我們看看基本面是否推動了該公司的五年表現。
To quote Buffett, 'Ships will sail around the world but the Flat Earth Society will flourish. There will continue to be wide discrepancies between price and value in the marketplace...' One imperfect but simple way to consider how the market perception of a company has shifted is to compare the change in the earnings per share (EPS) with the share price movement.
引用巴菲特的話:「船隻將周遊世界,而『地平派』仍會興旺。市場上的價格和價值仍會存在廣泛的差距……」考慮一家公司在市場上的認知如何變化的一個不完美但簡單的方法是比較每股收益(EPS)的變化和股價的波動。
During five years of share price growth, FinVolution Group actually saw its EPS drop 2.1% per year.
在股價增長的五年中,FinVolution Group實際上每年EPS下降2.1%。
So it's hard to argue that the earnings per share are the best metric to judge the company, as it may not be optimized for profits at this point. Therefore, it's worth taking a look at other metrics to try to understand the share price movements.
因此,很難認爲每股收益是判斷公司的最佳指標,因爲它可能在此時未被優化以獲取利潤。因此,值得查看其他指標以嘗試了解股價的動向。
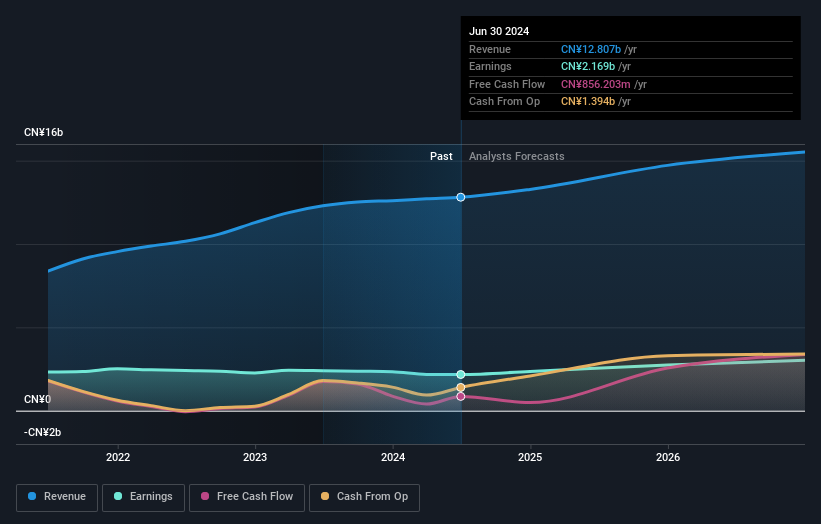
On the other hand, FinVolution Group's revenue is growing nicely, at a compound rate of 17% over the last five years. It's quite possible that management are prioritizing revenue growth over EPS growth at the moment.
另一方面,凡普金科集團的營業收入增長相當不錯,在過去五年裏以17%的複合率增長。很可能管理層目前更加註重營業收入增長而不是每股收益增長。
You can see below how earnings and revenue have changed over time (discover the exact values by clicking on the image).
您可以看到以下收益和營收的變化情況(通過單擊圖像了解精確值)。
Take a more thorough look at FinVolution Group's financial health with this free report on its balance sheet.
通過這份關於凡普金科集團資產負債表的免費報告,更全面地了解其財務狀況。
What About Dividends?
那麼分紅怎麼樣呢?
When looking at investment returns, it is important to consider the difference between total shareholder return (TSR) and share price return. Whereas the share price return only reflects the change in the share price, the TSR includes the value of dividends (assuming they were reinvested) and the benefit of any discounted capital raising or spin-off. So for companies that pay a generous dividend, the TSR is often a lot higher than the share price return. In the case of FinVolution Group, it has a TSR of 121% for the last 5 years. That exceeds its share price return that we previously mentioned. The dividends paid by the company have thusly boosted the total shareholder return.
在考慮投資回報時,重要的是要考慮總股東回報率(TSR)和股價回報之間的差異。而股價回報只反映了股價的變動,TSR包括了紅利的價值(假設進行了再投資)以及任何折價增資或拆分帶來的利益。所以對於支付慷慨紅利的公司,TSR往往要高得多。對於凡普金科集團來說,在過去5年裏,其TSR達到了121%。這超過了之前提到的股價回報。公司支付的紅利因此提升了總股東回報。
A Different Perspective
不同的觀點
FinVolution Group provided a TSR of 12% over the last twelve months. Unfortunately this falls short of the market return. On the bright side, the longer term returns (running at about 17% a year, over half a decade) look better. It's quite possible the business continues to execute with prowess, even as the share price gains are slowing. I find it very interesting to look at share price over the long term as a proxy for business performance. But to truly gain insight, we need to consider other information, too. Case in point: We've spotted 2 warning signs for FinVolution Group you should be aware of, and 1 of them is a bit unpleasant.
Finvolution集團在過去十二個月提供了12%的TSR。不幸的是,這低於市場回報。但值得欣慰的是,長期回報率(在過去半個世紀的時間裏大約爲17%)看起來更好。很可能業務持續高效運行,即使股價漲幅在減緩。我發現長期觀察股價作爲業務績效的一種指標非常有趣。但要真正獲得洞察,我們還需要考慮其他信息。舉個例子: 我們發現Finvolution集團有2個警示信號,您應該注意,其中有1個有點不愉快。
If you are like me, then you will not want to miss this free list of undervalued small caps that insiders are buying.
如果您像我一樣,就不會希望錯過這份免費的內部人士正在購買的低估小市值股票列表。
Please note, the market returns quoted in this article reflect the market weighted average returns of stocks that currently trade on American exchanges.
請注意,本文所引述的市場回報反映了目前在美國交易所上市的股票的市場加權平均回報。
Have feedback on this article? Concerned about the content? Get in touch with us directly. Alternatively, email editorial-team (at) simplywallst.com.
This article by Simply Wall St is general in nature. We provide commentary based on historical data and analyst forecasts only using an unbiased methodology and our articles are not intended to be financial advice. It does not constitute a recommendation to buy or sell any stock, and does not take account of your objectives, or your financial situation. We aim to bring you long-term focused analysis driven by fundamental data. Note that our analysis may not factor in the latest price-sensitive company announcements or qualitative material. Simply Wall St has no position in any stocks mentioned.
對本文有任何反饋?對內容有任何疑慮?請直接與我們聯繫。或者,發送電子郵件至editorial-team@simplywallst.com。
這篇文章是Simply Wall St的一般性文章。我們根據歷史數據和分析師預測提供評論,只使用公正的方法論,我們的文章並不意味着提供任何金融建議。文章不構成買賣任何股票的建議,也不考慮您的目標或您的財務狀況。我們的目標是帶給您基本數據驅動的長期關注分析。請注意,我們的分析可能不考慮最新的價格敏感公司公告或定性材料。Simply Wall St沒有任何股票頭寸。
譯文內容由第三人軟體翻譯。