
Lear (NYSE:LEA) May Have Issues Allocating Its Capital
Lear (NYSE:LEA) May Have Issues Allocating Its Capital
 0.12 = US$1.0b ÷ (US$15b - US$5.8b)
 Ignoring the stock price of a company, what are the underlying trends that tell us a business is past the growth phase? A business that's potentially in decline often shows two trends, a return on capital employed (ROCE) that's declining, and a base of capital employed that's also declining. Trends like this ultimately mean the business is reducing its investments and also earning less on what it has invested. So after glancing at the trends within Lear (NYSE:LEA), we weren't too hopeful.
忽略公司的股價,有哪些潛在趨勢告訴我們一個企業已經經過了成長階段?一個潛在處於衰退狀態的企業通常會表現出兩種趨勢,即資本使用效率(ROCE)下降,以及使用資本的基礎也在下降。這樣的趨勢最終意味着企業在減少投資,並且對其投資所獲得的回報也在減少。因此,初步了解了李爾(紐交所:LEA)內部趨勢後,我們的希望並不是太高。
What Is Return On Capital Employed (ROCE)?
我們對 Enphase Energy 的資本僱用回報率的看法:正如我們上面看到的,Enphase Energy 的資本回報率沒有提高,但它正在重新投資於業務。投資者必須認爲未來會有更好的前景,因爲股票表現良好,使持股五年以上的股東獲得了 690% 的收益。最終,如果基本趨勢持續存在,我們不會對它成爲一隻多頭股持有期很久很有信心。
For those who don't know, ROCE is a measure of a company's yearly pre-tax profit (its return), relative to the capital employed in the business. The formula for this calculation on Lear is:
對於不了解的人來說,ROCE是衡量公司年度稅前利潤(其回報),相對於企業使用的資本的一種度量。在李爾的計算公式爲:
Return on Capital Employed = Earnings Before Interest and Tax (EBIT) ÷ (Total Assets - Current Liabilities)
資產僱用回報率(ROCE)是指企業利潤,即企業稅前利潤除以企業投入的總資本(負債加股權)。如果ROCE高於企業財務成本的承受能力,那麼企業就會創造出更多的價值。
0.12 = US$1.0b ÷ (US$15b - US$5.8b) (Based on the trailing twelve months to June 2024).
0.12 = 100億美元 ÷(150億美元 - 5.8億美元)(基於截至2024年6月的最近十二個月)。
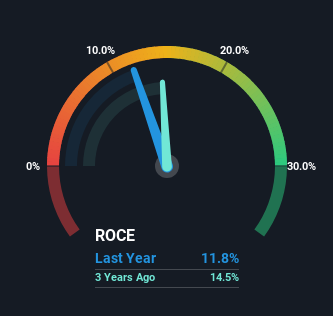
Thus, Lear has an ROCE of 12%. That's a relatively normal return on capital, and it's around the 11% generated by the Auto Components industry.
因此,李爾的ROCE爲12%。這是一個相對正常的資本回報率,大約與汽車元件行業所產生的11%相當。
Above you can see how the current ROCE for Lear compares to its prior returns on capital, but there's only so much you can tell from the past. If you're interested, you can view the analysts predictions in our free analyst report for Lear .
在上面,您可以看到李爾當前的資本回報率與其先前的資本回報率相比,但過去只能得出有限的結論。如果您有興趣,您可以在我們的免費分析師報告中查看分析師的預測。
So How Is Lear's ROCE Trending?
那麼Lear的ROCE趨勢如何?
There is reason to be cautious about Lear, given the returns are trending downwards. Unfortunately the returns on capital have diminished from the 18% that they were earning five years ago. On top of that, it's worth noting that the amount of capital employed within the business has remained relatively steady. This combination can be indicative of a mature business that still has areas to deploy capital, but the returns received aren't as high due potentially to new competition or smaller margins. So because these trends aren't typically conducive to creating a multi-bagger, we wouldn't hold our breath on Lear becoming one if things continue as they have.
對於李爾,存在謹慎的理由,因爲回報率呈下降趨勢。不幸的是,資本回報率已經從五年前的18%下降。除此之外,值得注意的是企業所投入的資本量保持相對穩定。這種組合可能表明成熟的企業仍有利用資本的領域,但由於可能存在新競爭或較小的利潤率,所獲得的回報並不高。因此,由於這些趨勢通常不利於創造多倍投資收益,如果情況繼續下去,我們不會對李爾成爲這種股票抱太大希望。
The Bottom Line
還有一件事需要注意的是,我們已經確定了上海醫藥的2個警告信號,了解這些信號應該成爲你的投資過程的一部分。
In the end, the trend of lower returns on the same amount of capital isn't typically an indication that we're looking at a growth stock. And long term shareholders have watched their investments stay flat over the last five years. Unless there is a shift to a more positive trajectory in these metrics, we would look elsewhere.
最終,相同資本的回報率下降的趨勢通常不是我們正在尋找的成長股的跡象。長期股東在過去五年裏眼睜睜見證他們的投資停滯不前。除非這些指標轉向更積極的軌跡,否則我們會尋找其他地方。
On a separate note, we've found 1 warning sign for Lear you'll probably want to know about.
另外,我們發現了李爾的1個警示信號,您可能會想知道。
If you want to search for solid companies with great earnings, check out this free list of companies with good balance sheets and impressive returns on equity.
如果您想尋找財務狀況良好、回報卓越的實力強企業,可以免費查看以下公司列表。
Have feedback on this article? Concerned about the content? Get in touch with us directly. Alternatively, email editorial-team (at) simplywallst.com.
This article by Simply Wall St is general in nature. We provide commentary based on historical data and analyst forecasts only using an unbiased methodology and our articles are not intended to be financial advice. It does not constitute a recommendation to buy or sell any stock, and does not take account of your objectives, or your financial situation. We aim to bring you long-term focused analysis driven by fundamental data. Note that our analysis may not factor in the latest price-sensitive company announcements or qualitative material. Simply Wall St has no position in any stocks mentioned.
對本文有任何反饋?對內容有任何疑慮?請直接與我們聯繫。或者,發送電子郵件至editorial-team@simplywallst.com。
這篇文章是Simply Wall St的一般性文章。我們根據歷史數據和分析師預測提供評論,只使用公正的方法論,我們的文章並不意味着提供任何金融建議。文章不構成買賣任何股票的建議,也不考慮您的目標或您的財務狀況。我們的目標是帶給您基本數據驅動的長期關注分析。請注意,我們的分析可能不考慮最新的價格敏感公司公告或定性材料。Simply Wall St沒有任何股票頭寸。
譯文內容由第三人軟體翻譯。