
Silicon Laboratories (NASDAQ:SLAB) Adds US$128m to Market Cap in the Past 7 Days, Though Investors From Three Years Ago Are Still Down 25%
Silicon Laboratories (NASDAQ:SLAB) Adds US$128m to Market Cap in the Past 7 Days, Though Investors From Three Years Ago Are Still Down 25%
 Over three years, Silicon Laboratories grew revenue at 1.5% per year. That's not a very high growth rate considering it doesn't make profits. Indeed, the stock dropped 8% over the last three years. If revenue growth accelerates, we might see the share price bounce. But ultimately the key will be whether the company can become profitability.
 As an investor its worth striving to ensure your overall portfolio beats the market average. But the risk of stock picking is that you will likely buy under-performing companies. We regret to report that long term Silicon Laboratories Inc. (NASDAQ:SLAB) shareholders have had that experience, with the share price dropping 25% in three years, versus a market return of about 20%.
作爲投資者,努力確保你的整體投資組合超過市場平均水平是值得的。但是,單獨選擇股票的風險在於你很可能買入表現不佳的公司。遺憾的是,長揸芯科實驗室股票(納斯達克: SLAB)的股東們有着這樣的經歷,股價在三年內下跌了25%,而市場回報率約爲20%。
While the stock has risen 3.7% in the past week but long term shareholders are still in the red, let's see what the fundamentals can tell us.
雖然該股在過去一週上漲了3.7%,但長期持股人仍處於赤字中,讓我們看看基本面可以告訴我們什麼。
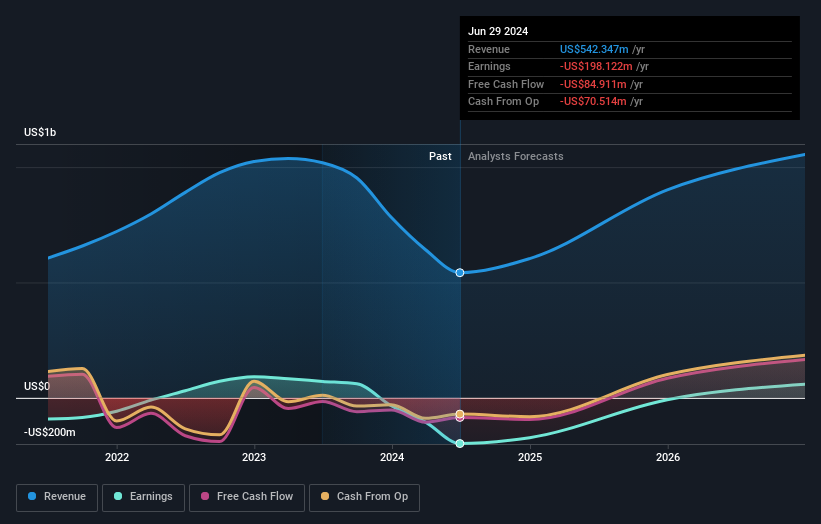
Given that Silicon Laboratories didn't make a profit in the last twelve months, we'll focus on revenue growth to form a quick view of its business development. Shareholders of unprofitable companies usually desire strong revenue growth. That's because fast revenue growth can be easily extrapolated to forecast profits, often of considerable size.
鑑於芯科實驗室過去十二個月沒有盈利,我們將重點關注營業收入增長,以便快速了解其業務發展情況。不盈利公司的股東通常希望有強勁的營業收入增長。因爲快速的營業收入增長可以很容易地推斷出可觀的利潤預期。
Over three years, Silicon Laboratories grew revenue at 1.5% per year. That's not a very high growth rate considering it doesn't make profits. Indeed, the stock dropped 8% over the last three years. If revenue growth accelerates, we might see the share price bounce. But ultimately the key will be whether the company can become profitability.
在過去的三年中,芯科實驗室的營業收入每年增長1.5%。考慮到其不盈利,這不是一個非常高的增長率。事實上,股價在過去三年中下跌了8%。如果營業收入增速加快,我們可能會看到股價反彈。但歸根結底,關鍵將在於該公司是否能夠實現盈利。
You can see how earnings and revenue have changed over time in the image below (click on the chart to see the exact values).
你可以在下面的圖片中看到收入和營業收入隨時間的變化情況(單擊圖表可查看精確值)。
Take a more thorough look at Silicon Laboratories' financial health with this free report on its balance sheet.
通過這份關於芯科實驗室資產負債表的免費報告,更全面地了解其財務狀況。
A Different Perspective
不同的觀點
Investors in Silicon Laboratories had a tough year, with a total loss of 3.3%, against a market gain of about 30%. However, keep in mind that even the best stocks will sometimes underperform the market over a twelve month period. Unfortunately, last year's performance may indicate unresolved challenges, given that it was worse than the annualised loss of 0.5% over the last half decade. We realise that Baron Rothschild has said investors should "buy when there is blood on the streets", but we caution that investors should first be sure they are buying a high quality business. Most investors take the time to check the data on insider transactions. You can click here to see if insiders have been buying or selling.
持有芯科實驗室股票的投資者度過了艱難的一年,總虧損達3.3%,而市場的增長率約爲30%。然而,請記住,即使是最好的股票有時也會在十二個月的期間表現不佳。不幸的是,去年的表現可能表明存在未解決的挑戰,因爲它比過去半個世紀的年化虧損率0.5%更糟糕。我們意識到巴隆·羅斯柴爾德曾說過投資者應該「在街上有鮮血時買入」,但我們警告投資者應首先確保他們在購買高質量的業務。大多數投資者都花時間檢查內部交易數據。您可以點擊這裏查看內部人員是否一直在買入或賣出。
But note: Silicon Laboratories may not be the best stock to buy. So take a peek at this free list of interesting companies with past earnings growth (and further growth forecast).
但請注意:芯科實驗室可能不是最佳的股票買入選擇。因此,請查看這份有過往盈利增長(及進一步增長預測)的有趣公司的免費名單。
Please note, the market returns quoted in this article reflect the market weighted average returns of stocks that currently trade on American exchanges.
請注意,本文所引述的市場回報反映了目前在美國交易所上市的股票的市場加權平均回報。
Have feedback on this article? Concerned about the content? Get in touch with us directly. Alternatively, email editorial-team (at) simplywallst.com.
This article by Simply Wall St is general in nature. We provide commentary based on historical data and analyst forecasts only using an unbiased methodology and our articles are not intended to be financial advice. It does not constitute a recommendation to buy or sell any stock, and does not take account of your objectives, or your financial situation. We aim to bring you long-term focused analysis driven by fundamental data. Note that our analysis may not factor in the latest price-sensitive company announcements or qualitative material. Simply Wall St has no position in any stocks mentioned.
對本文有任何反饋?對內容有任何疑慮?請直接與我們聯繫。或者,發送電子郵件至editorial-team@simplywallst.com。
這篇文章是Simply Wall St的一般性文章。我們根據歷史數據和分析師預測提供評論,只使用公正的方法論,我們的文章並不意味着提供任何金融建議。文章不構成買賣任何股票的建議,也不考慮您的目標或您的財務狀況。我們的目標是帶給您基本數據驅動的長期關注分析。請注意,我們的分析可能不考慮最新的價格敏感公司公告或定性材料。Simply Wall St沒有任何股票頭寸。
譯文內容由第三人軟體翻譯。