
Investing in W. R. Berkley (NYSE:WRB) Three Years Ago Would Have Delivered You a 96% Gain
Investing in W. R. Berkley (NYSE:WRB) Three Years Ago Would Have Delivered You a 96% Gain
By buying an index fund, you can roughly match the market return with ease. But if you pick the right individual stocks, you could make more than that. For example, W. R. Berkley Corporation (NYSE:WRB) shareholders have seen the share price rise 83% over three years, well in excess of the market return (15%, not including dividends). However, more recent returns haven't been as impressive as that, with the stock returning just 38% in the last year, including dividends.
通過購買指數基金,您可以輕鬆地大致匹配市場回報。但是如果您選擇正確的個別股票,您可以獲得比這更多的回報。例如,美國W. R. Berkley Corporation(紐交所:WRB)的股東在三年內看到股價上漲了83%,遠遠超過市場回報(15%,不包括分紅)。然而,最近的回報並不像那樣令人印象深刻,該股票在過去一年內僅上漲了38%,包括分紅。
Now it's worth having a look at the company's fundamentals too, because that will help us determine if the long term shareholder return has matched the performance of the underlying business.
現在值得更詳細地了解該公司的基本面,因爲這將幫助我們判斷長期股東回報是否與基礎業務的表現相匹配。
While the efficient markets hypothesis continues to be taught by some, it has been proven that markets are over-reactive dynamic systems, and investors are not always rational. One imperfect but simple way to consider how the market perception of a company has shifted is to compare the change in the earnings per share (EPS) with the share price movement.
雖然一些人仍然相信有效市場假說,但已經證明市場是過度反應的動態系統,投資者並不總是理性的。一個不完美但簡單的方法來考慮公司市場看法的變化是比較每股收益(EPS)的變化和股價的波動。
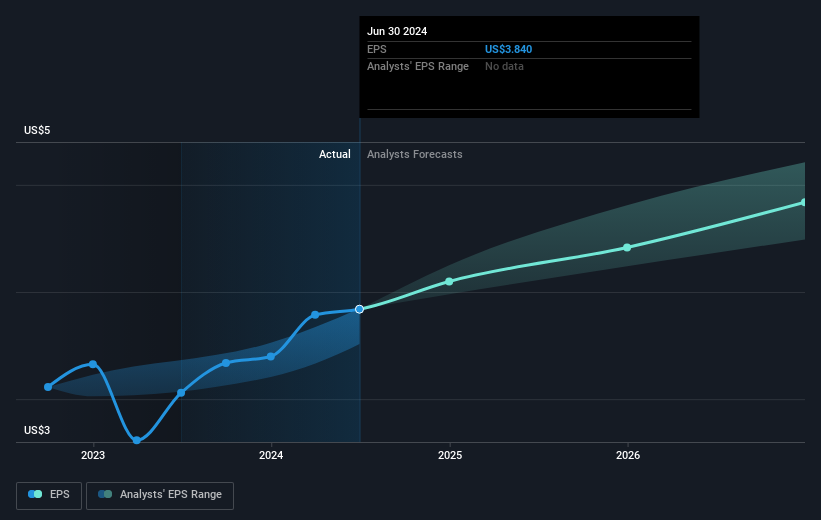
W. R. Berkley was able to grow its EPS at 22% per year over three years, sending the share price higher. This EPS growth is remarkably close to the 22% average annual increase in the share price. This observation indicates that the market's attitude to the business hasn't changed all that much. Rather, the share price has approximately tracked EPS growth.
在過去的三年中,W. R. Berkley的每股收益年均增長22%,推高股價。這種每股收益增長與股價的年均增長22%非常接近。這一觀察表明,市場對該業務的態度並沒有發生太大變化。相反,股價大致跟蹤每股收益的增長。
You can see how EPS has changed over time in the image below (click on the chart to see the exact values).
您可以在下面的圖片中查看每股收益如何隨時間變化(單擊圖表以查看確切的價值)。
We know that W. R. Berkley has improved its bottom line lately, but is it going to grow revenue? You could check out this free report showing analyst revenue forecasts.
我們知道W. R. Berkley最近改善了其底線,但它是否將增加營業收入?您可以查看這份免費報告,其中顯示分析師對營業收入的預測。
What About Dividends?
那麼分紅怎麼樣呢?
When looking at investment returns, it is important to consider the difference between total shareholder return (TSR) and share price return. The TSR incorporates the value of any spin-offs or discounted capital raisings, along with any dividends, based on the assumption that the dividends are reinvested. So for companies that pay a generous dividend, the TSR is often a lot higher than the share price return. We note that for W. R. Berkley the TSR over the last 3 years was 96%, which is better than the share price return mentioned above. The dividends paid by the company have thusly boosted the total shareholder return.
在考慮投資回報率時,重要的是要考慮總股東回報率(TSR)與股票價格回報率之間的差異。TSR包括任何分拆或折扣資本籌集活動的價值,以及任何根據假設分紅再投資的股息。因此,對於支付豐厚股息的公司,TSR通常比股票價格回報率高得多。我們注意到W. R. Berkley近3年的TSR爲96%,這比上述股票價格回報率要好。公司支付的股息因此提升了總股東回報率。
A Different Perspective
不同的觀點
It's nice to see that W. R. Berkley shareholders have received a total shareholder return of 38% over the last year. Of course, that includes the dividend. That gain is better than the annual TSR over five years, which is 15%. Therefore it seems like sentiment around the company has been positive lately. Someone with an optimistic perspective could view the recent improvement in TSR as indicating that the business itself is getting better with time. Is W. R. Berkley cheap compared to other companies? These 3 valuation measures might help you decide.
很高興看到W. R. Berkley股東在過去一年裏獲得了38%的總股東回報率。當然,這包括了股息。這種收益高於過去五年的年度TSR,即15%。因此,近期市場對該公司的情緒似乎一直很積極。持有樂觀態度的人可能會認爲TSR的最新改善表明業務本身正在逐漸變得更好。與其他公司相比,W. R. Berkley便宜嗎?這三個估值指標可能會幫助您做出決策。
Of course W. R. Berkley may not be the best stock to buy. So you may wish to see this free collection of growth stocks.
當然,W. R. Berkley可能不是最好的股票買入選擇,所以您可能希望查看這個免費的增長股票收藏。
Please note, the market returns quoted in this article reflect the market weighted average returns of stocks that currently trade on American exchanges.
請注意,本文所引述的市場回報反映了目前在美國交易所上市的股票的市場加權平均回報。
Have feedback on this article? Concerned about the content? Get in touch with us directly. Alternatively, email editorial-team (at) simplywallst.com.
This article by Simply Wall St is general in nature. We provide commentary based on historical data and analyst forecasts only using an unbiased methodology and our articles are not intended to be financial advice. It does not constitute a recommendation to buy or sell any stock, and does not take account of your objectives, or your financial situation. We aim to bring you long-term focused analysis driven by fundamental data. Note that our analysis may not factor in the latest price-sensitive company announcements or qualitative material. Simply Wall St has no position in any stocks mentioned.
對本文有任何反饋?對內容有任何疑慮?請直接與我們聯繫。或者,發送電子郵件至editorial-team@simplywallst.com。
這篇文章是Simply Wall St的一般性文章。我們根據歷史數據和分析師預測提供評論,只使用公正的方法論,我們的文章並不意味着提供任何金融建議。文章不構成買賣任何股票的建議,也不考慮您的目標或您的財務狀況。我們的目標是帶給您基本數據驅動的長期關注分析。請注意,我們的分析可能不考慮最新的價格敏感公司公告或定性材料。Simply Wall St沒有任何股票頭寸。
譯文內容由第三人軟體翻譯。