
Returns At Oxford Industries (NYSE:OXM) Are On The Way Up
Returns At Oxford Industries (NYSE:OXM) Are On The Way Up
 0.16 = US$152m ÷ (US$1.2b - US$227m)
 If you're not sure where to start when looking for the next multi-bagger, there are a few key trends you should keep an eye out for. In a perfect world, we'd like to see a company investing more capital into its business and ideally the returns earned from that capital are also increasing. Ultimately, this demonstrates that it's a business that is reinvesting profits at increasing rates of return. With that in mind, we've noticed some promising trends at Oxford Industries (NYSE:OXM) so let's look a bit deeper.
如果你不確定從哪裏開始尋找下一個多倍收益,有一些關鍵趨勢你應該注意。在完美的世界中,我們希望看到一家公司將更多資本投入到業務中,而且這些資本所獲得的回報也在增加。最終,這表明這是一家以不斷增加的回報率再投資利潤的企業。考慮到這一點,我們注意到了牛津工業(NYSE:OXM)的一些有希望的趨勢,讓我們深入了解一下。
What Is Return On Capital Employed (ROCE)?
我們對 Enphase Energy 的資本僱用回報率的看法:正如我們上面看到的,Enphase Energy 的資本回報率沒有提高,但它正在重新投資於業務。投資者必須認爲未來會有更好的前景,因爲股票表現良好,使持股五年以上的股東獲得了 690% 的收益。最終,如果基本趨勢持續存在,我們不會對它成爲一隻多頭股持有期很久很有信心。
If you haven't worked with ROCE before, it measures the 'return' (pre-tax profit) a company generates from capital employed in its business. Analysts use this formula to calculate it for Oxford Industries:
如果您以前沒有使用ROCE,它衡量了一家公司在業務中使用的資本所產生的「回報」(稅前利潤)。分析師使用這個公式來計算牛津工業的ROCE:
Return on Capital Employed = Earnings Before Interest and Tax (EBIT) ÷ (Total Assets - Current Liabilities)
資產僱用回報率(ROCE)是指企業利潤,即企業稅前利潤除以企業投入的總資本(負債加股權)。如果ROCE高於企業財務成本的承受能力,那麼企業就會創造出更多的價值。
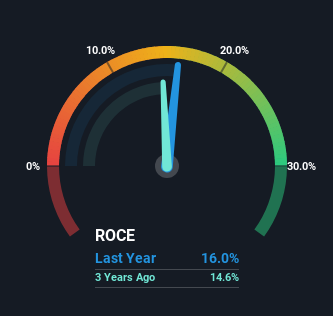
0.16 = US$152m ÷ (US$1.2b - US$227m) (Based on the trailing twelve months to August 2024).
0.16 = 1.52億美元 ÷ (12億美元 - 2.27億美元)(基於2024年8月的過去十二個月)。
Therefore, Oxford Industries has an ROCE of 16%. On its own, that's a standard return, however it's much better than the 13% generated by the Luxury industry.
因此,牛津工業的ROCE爲16%。單獨來看,這是一個標準的回報率,然而它要比奢侈品行業的13%要好得多。
In the above chart we have measured Oxford Industries' prior ROCE against its prior performance, but the future is arguably more important. If you're interested, you can view the analysts predictions in our free analyst report for Oxford Industries .
在上面的圖表中,我們對牛津工業以往的ROCE表現進行了測量,但未來可能更爲重要。如果您有興趣,您可以在我們爲牛津工業撰寫的免費分析師報告中查看分析師的預測。
What Does the ROCE Trend For Oxford Industries Tell Us?
牛津工業的ROCE趨勢給我們帶來了什麼啓示?
Oxford Industries' ROCE growth is quite impressive. Looking at the data, we can see that even though capital employed in the business has remained relatively flat, the ROCE generated has risen by 39% over the last five years. So our take on this is that the business has increased efficiencies to generate these higher returns, all the while not needing to make any additional investments. On that front, things are looking good so it's worth exploring what management has said about growth plans going forward.
牛津工業的ROCE增長非常可觀。從數據上看,儘管業務中使用的資本保持相對平穩,但ROCE在過去五年中增長了39%。因此,我們認爲企業增加了效率以實現這些更高的回報,而且不需要進行任何額外的投資。在這方面,情況看起來不錯,值得探討管理層對未來增長計劃的說法。
What We Can Learn From Oxford Industries' ROCE
從牛津工業的ROCE中我們可以學到什麼
In summary, we're delighted to see that Oxford Industries has been able to increase efficiencies and earn higher rates of return on the same amount of capital. Investors may not be impressed by the favorable underlying trends yet because over the last five years the stock has only returned 35% to shareholders. So with that in mind, we think the stock deserves further research.
總之,我們很高興看到牛津工業在相同的資本投入下提高了效率並獲得了更高的回報率。由於在過去五年中,股票僅爲股東帶來了35%的回報,投資者可能還不會對這些有利的潛在趨勢印象深刻。因此,我們認爲該股票值得進一步研究。
If you want to continue researching Oxford Industries, you might be interested to know about the 3 warning signs that our analysis has discovered.
如果您想繼續研究牛津工業,您可能會對我們的分析發現的3個預警信號感興趣。
For those who like to invest in solid companies, check out this free list of companies with solid balance sheets and high returns on equity.
Hao Tian International Construction Investment Group確實存在一些風險,我們已經發現了一條警示標誌,你可能會感興趣。對於那些喜歡投資於實力雄厚的公司的人,可以查看這個由財務狀況強大、股本回報率高的公司組成的免費列表。
Have feedback on this article? Concerned about the content? Get in touch with us directly. Alternatively, email editorial-team (at) simplywallst.com.
This article by Simply Wall St is general in nature. We provide commentary based on historical data and analyst forecasts only using an unbiased methodology and our articles are not intended to be financial advice. It does not constitute a recommendation to buy or sell any stock, and does not take account of your objectives, or your financial situation. We aim to bring you long-term focused analysis driven by fundamental data. Note that our analysis may not factor in the latest price-sensitive company announcements or qualitative material. Simply Wall St has no position in any stocks mentioned.
對本文有任何反饋?對內容有任何疑慮?請直接與我們聯繫。或者,發送電子郵件至editorial-team@simplywallst.com。
這篇文章是Simply Wall St的一般性文章。我們根據歷史數據和分析師預測提供評論,只使用公正的方法論,我們的文章並不意味着提供任何金融建議。文章不構成買賣任何股票的建議,也不考慮您的目標或您的財務狀況。我們的目標是帶給您基本數據驅動的長期關注分析。請注意,我們的分析可能不考慮最新的價格敏感公司公告或定性材料。Simply Wall St沒有任何股票頭寸。
譯文內容由第三人軟體翻譯。
