
Slowing Rates Of Return At Nordson (NASDAQ:NDSN) Leave Little Room For Excitement
Slowing Rates Of Return At Nordson (NASDAQ:NDSN) Leave Little Room For Excitement
 0.15 = US$688m ÷ (US$5.2b - US$518m)
 There are a few key trends to look for if we want to identify the next multi-bagger. Ideally, a business will show two trends; firstly a growing return on capital employed (ROCE) and secondly, an increasing amount of capital employed. Ultimately, this demonstrates that it's a business that is reinvesting profits at increasing rates of return. So, when we ran our eye over Nordson's (NASDAQ:NDSN) trend of ROCE, we liked what we saw.
如果我們想找到下一個潛力股,有幾個關鍵趨勢需要留意。理想情況下,一家企業將展示兩個趨勢;首先是不斷增長的資本運營回報率(ROCE),其次是不斷增加的資本運營量。最終,這表明這是一家以遞增回報率重新投資利潤的企業。因此,當我們審視Nordson(NASDAQ:NDSN)的ROCE趨勢時,我們對所見到的內容感到滿意。
Understanding Return On Capital Employed (ROCE)
上面您可以看到蒙托克可再生能源現行ROCE與之前資本回報的比較,但過去只能知道這麼多。如果您感興趣,可以查看我們免費的蒙托克可再生能源分析師報告,了解分析師的預測。
If you haven't worked with ROCE before, it measures the 'return' (pre-tax profit) a company generates from capital employed in its business. To calculate this metric for Nordson, this is the formula:
如果你以前沒有接觸過ROCE,它是用來衡量公司從其業務中獲取的資本運營回報(稅前利潤)的指標。對於Nordson的計算公式如下:
Return on Capital Employed = Earnings Before Interest and Tax (EBIT) ÷ (Total Assets - Current Liabilities)
資產僱用回報率(ROCE)是指企業利潤,即企業稅前利潤除以企業投入的總資本(負債加股權)。如果ROCE高於企業財務成本的承受能力,那麼企業就會創造出更多的價值。
0.15 = US$688m ÷ (US$5.2b - US$518m) (Based on the trailing twelve months to July 2024).
0.15 = 6.88億美元 ÷(52億美元 - 5.18億美元)(基於2024年7月的過去十二個月)。
So, Nordson has an ROCE of 15%. In absolute terms, that's a pretty normal return, and it's somewhat close to the Machinery industry average of 13%.
因此,Nordson的ROCE爲15%。從絕對值來看,這是一個相當正常的回報率,並且與機械行業平均水平13%相當接近。
In the above chart we have measured Nordson's prior ROCE against its prior performance, but the future is arguably more important. If you'd like, you can check out the forecasts from the analysts covering Nordson for free.
在上面的圖表中,我們對Nordson之前的ROCE進行了測量,但未來可能更重要。如果您願意,您可以免費查看覆蓋Nordson的分析師們的預測。
What Does the ROCE Trend For Nordson Tell Us?
Nordson的ROCE趨勢告訴我們什麼?
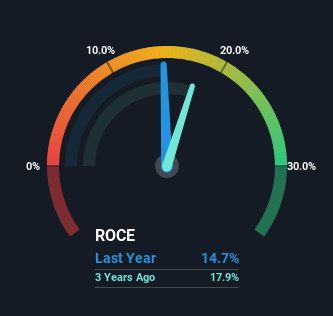
While the current returns on capital are decent, they haven't changed much. The company has employed 54% more capital in the last five years, and the returns on that capital have remained stable at 15%. 15% is a pretty standard return, and it provides some comfort knowing that Nordson has consistently earned this amount. Over long periods of time, returns like these might not be too exciting, but with consistency they can pay off in terms of share price returns.
儘管目前的資本回報率還可以,但沒有太大變化。公司在過去五年裏投入了54%的資本,而該資本的回報率保持在15%的穩定水平。15%是一個相當標準的回報率,這也讓人放心知道Nordson一直能夠持續獲得這樣的回報率。從長期來看,這樣的回報率可能不會太令人振奮,但是長期的穩定性可能會帶來股價的回報。
What We Can Learn From Nordson's ROCE
我們可以從Nordson的ROCE中學到什麼?
In the end, Nordson has proven its ability to adequately reinvest capital at good rates of return. And since the stock has risen strongly over the last five years, it appears the market might expect this trend to continue. So even though the stock might be more "expensive" than it was before, we think the strong fundamentals warrant this stock for further research.
最後,Nordson證明了其能夠以良好的回報率充分再投資資本的能力。由於股票在過去五年裏表現強勁,市場可能預期這一趨勢將繼續下去。因此,即使股票可能比以前更「昂貴」,我們認爲強勁的基本面值得進一步研究該股。
If you want to continue researching Nordson, you might be interested to know about the 1 warning sign that our analysis has discovered.
如果您想繼續研究Nordson,您可能會對我們的分析發現的1個警示信號感興趣。
While Nordson isn't earning the highest return, check out this free list of companies that are earning high returns on equity with solid balance sheets.
雖然Nordson的回報率並不是最高的,但您可以查看這個免費的企業名單,這些公司在股權回報和穩健資產負債表上都具有較高的回報率。
Have feedback on this article? Concerned about the content? Get in touch with us directly. Alternatively, email editorial-team (at) simplywallst.com.
This article by Simply Wall St is general in nature. We provide commentary based on historical data and analyst forecasts only using an unbiased methodology and our articles are not intended to be financial advice. It does not constitute a recommendation to buy or sell any stock, and does not take account of your objectives, or your financial situation. We aim to bring you long-term focused analysis driven by fundamental data. Note that our analysis may not factor in the latest price-sensitive company announcements or qualitative material. Simply Wall St has no position in any stocks mentioned.
對本文有任何反饋?對內容有任何疑慮?請直接與我們聯繫。或者,發送電子郵件至editorial-team@simplywallst.com。
這篇文章是Simply Wall St的一般性文章。我們根據歷史數據和分析師預測提供評論,只使用公正的方法論,我們的文章並不意味着提供任何金融建議。文章不構成買賣任何股票的建議,也不考慮您的目標或您的財務狀況。我們的目標是帶給您基本數據驅動的長期關注分析。請注意,我們的分析可能不考慮最新的價格敏感公司公告或定性材料。Simply Wall St沒有任何股票頭寸。
譯文內容由第三人軟體翻譯。
