
There's Been No Shortage Of Growth Recently For Chart Industries' (NYSE:GTLS) Returns On Capital
There's Been No Shortage Of Growth Recently For Chart Industries' (NYSE:GTLS) Returns On Capital
 0.08 = US$586m ÷ (US$9.3b - US$1.9b)
 If we want to find a stock that could multiply over the long term, what are the underlying trends we should look for? Firstly, we'll want to see a proven return on capital employed (ROCE) that is increasing, and secondly, an expanding base of capital employed. This shows us that it's a compounding machine, able to continually reinvest its earnings back into the business and generate higher returns. So on that note, Chart Industries (NYSE:GTLS) looks quite promising in regards to its trends of return on capital.
如果我們想要找到一支能夠長期增值的股票,我們應該關注哪些潛在的趨勢呢?首先,我們希望看到資本使用效率 (ROCE) 不斷增長,其次是資本使用的基礎不斷擴大。這向我們表明這是一個複利機器,能夠不斷將其收益再投入業務,並創造更高的回報。因此,在這一點上,查特工業 (紐交所:GTLS) 在資本回報率的趨勢方面看起來相當有前途。
Understanding Return On Capital Employed (ROCE)
上面您可以看到蒙托克可再生能源現行ROCE與之前資本回報的比較,但過去只能知道這麼多。如果您感興趣,可以查看我們免費的蒙托克可再生能源分析師報告,了解分析師的預測。
If you haven't worked with ROCE before, it measures the 'return' (pre-tax profit) a company generates from capital employed in its business. To calculate this metric for Chart Industries, this is the formula:
如果你之前沒有接觸過ROCE,它是衡量公司從資本使用中產生的『回報』(稅前利潤)。要爲查特工業計算這一指標,使用以下公式:
Return on Capital Employed = Earnings Before Interest and Tax (EBIT) ÷ (Total Assets - Current Liabilities)
資產僱用回報率(ROCE)是指企業利潤,即企業稅前利潤除以企業投入的總資本(負債加股權)。如果ROCE高於企業財務成本的承受能力,那麼企業就會創造出更多的價值。
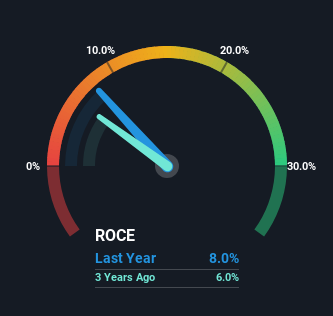
0.08 = US$586m ÷ (US$9.3b - US$1.9b) (Based on the trailing twelve months to June 2024).
0.08 = 5.86億美元 ÷ ( 93億美元 - 19億美元 ) (基於截至2024年6月的過去十二個月)。
Thus, Chart Industries has an ROCE of 8.0%. In absolute terms, that's a low return and it also under-performs the Machinery industry average of 13%.
因此,查特工業的資本回報率爲8.0%。就絕對數而言,這是一個較低的回報,也低於機械行業的平均13%。
In the above chart we have measured Chart Industries' prior ROCE against its prior performance, but the future is arguably more important. If you'd like, you can check out the forecasts from the analysts covering Chart Industries for free.
在上面的圖表中,我們已經測量過查特工業之前的ROCE與之前的業績,但未來可能更重要。如果您願意,可以免費查看分析師對查特工業的預測。
What Does the ROCE Trend For Chart Industries Tell Us?
查看查特工業的ROCE趨勢告訴我們什麼?
Even though ROCE is still low in absolute terms, it's good to see it's heading in the right direction. Over the last five years, returns on capital employed have risen substantially to 8.0%. The amount of capital employed has increased too, by 351%. The increasing returns on a growing amount of capital is common amongst multi-baggers and that's why we're impressed.
儘管ROCE從絕對數值上仍然較低,但看到它朝着正確的方向發展是令人高興的。在過去的五年中,資本利用率大幅提升至8.0%。資本利用額也增加了351%。在不斷增加的資本上獲得增長的回報是許多暴漲股中常見的,這也是爲什麼我們印象深刻的原因。
The Bottom Line
還有一件事需要注意的是,我們已經確定了上海醫藥的2個警告信號,了解這些信號應該成爲你的投資過程的一部分。
To sum it up, Chart Industries has proven it can reinvest in the business and generate higher returns on that capital employed, which is terrific. And investors seem to expect more of this going forward, since the stock has rewarded shareholders with a 70% return over the last five years. With that being said, we still think the promising fundamentals mean the company deserves some further due diligence.
總結一下,查特工業已經證明它能夠再投資業務並在投入的資本上產生更高的回報,這是非常出色的。投資者似乎期待未來會有更多這樣的情況,因爲過去五年該股票爲股東帶來了70%的回報。話雖如此,我們仍然認爲那些有前景的基本面意味着公司值得更進一步的盡職調查。
One more thing: We've identified 2 warning signs with Chart Industries (at least 1 which is significant) , and understanding them would certainly be useful.
再多說一句:對於查特工業,我們已經發現了2個警示信號(至少其中一個重大),了解它們肯定會很有用。
If you want to search for solid companies with great earnings, check out this free list of companies with good balance sheets and impressive returns on equity.
如果您想尋找財務狀況良好、回報卓越的實力強企業,可以免費查看以下公司列表。
Have feedback on this article? Concerned about the content? Get in touch with us directly. Alternatively, email editorial-team (at) simplywallst.com.
This article by Simply Wall St is general in nature. We provide commentary based on historical data and analyst forecasts only using an unbiased methodology and our articles are not intended to be financial advice. It does not constitute a recommendation to buy or sell any stock, and does not take account of your objectives, or your financial situation. We aim to bring you long-term focused analysis driven by fundamental data. Note that our analysis may not factor in the latest price-sensitive company announcements or qualitative material. Simply Wall St has no position in any stocks mentioned.
對本文有任何反饋?對內容有任何疑慮?請直接與我們聯繫。或者,發送電子郵件至editorial-team@simplywallst.com。
這篇文章是Simply Wall St的一般性文章。我們根據歷史數據和分析師預測提供評論,只使用公正的方法論,我們的文章並不意味着提供任何金融建議。文章不構成買賣任何股票的建議,也不考慮您的目標或您的財務狀況。我們的目標是帶給您基本數據驅動的長期關注分析。請注意,我們的分析可能不考慮最新的價格敏感公司公告或定性材料。Simply Wall St沒有任何股票頭寸。
譯文內容由第三人軟體翻譯。
