
Capital Allocation Trends At Power Integrations (NASDAQ:POWI) Aren't Ideal
Capital Allocation Trends At Power Integrations (NASDAQ:POWI) Aren't Ideal
What are the early trends we should look for to identify a stock that could multiply in value over the long term? Typically, we'll want to notice a trend of growing return on capital employed (ROCE) and alongside that, an expanding base of capital employed. Ultimately, this demonstrates that it's a business that is reinvesting profits at increasing rates of return. However, after investigating Power Integrations (NASDAQ:POWI), we don't think it's current trends fit the mold of a multi-bagger.
要確定一隻可以長期成倍增長的股票,我們應該尋找哪些早期趨勢?通常,我們會注意到已動用資本回報率(ROCE)的增長趨勢,與此同時,使用的資本基礎也在擴大。歸根結底,這表明這是一家以不斷提高的回報率對利潤進行再投資的企業。但是,在調查了Power Integrations(納斯達克股票代碼:POWI)之後,我們認爲目前的趨勢不符合多袋機的模式。
Return On Capital Employed (ROCE): What Is It?
資本使用回報率(ROCE):這是什麼?
For those that aren't sure what ROCE is, it measures the amount of pre-tax profits a company can generate from the capital employed in its business. To calculate this metric for Power Integrations, this is the formula:
對於那些不確定ROCE是什麼的人,它衡量的是公司從其業務中使用的資本中可以產生的稅前利潤金額。要計算功率積分的這個指標,公式如下:
Return on Capital Employed = Earnings Before Interest and Tax (EBIT) ÷ (Total Assets - Current Liabilities)
已動用資本回報率 = 息稅前收益 (EBIT) ¥(總資產-流動負債)
0.025 = US$19m ÷ (US$805m - US$50m) (Based on the trailing twelve months to June 2024).
0.025 = 1900萬美元 ÷(8.05億美元至5000萬美元)(基於截至2024年6月的過去十二個月)。
So, Power Integrations has an ROCE of 2.5%. Ultimately, that's a low return and it under-performs the Semiconductor industry average of 9.0%.
因此,Power Integrations的投資回報率爲2.5%。歸根結底,這是一個低迴報,其表現低於半導體行業9.0%的平均水平。
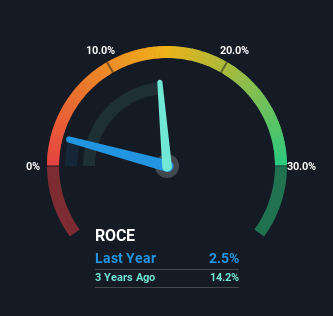
Above you can see how the current ROCE for Power Integrations compares to its prior returns on capital, but there's only so much you can tell from the past. If you'd like, you can check out the forecasts from the analysts covering Power Integrations for free.
上面你可以看到Power Integrations當前的投資回報率與其先前的資本回報率相比如何,但從過去可以看出來的只有那麼多。如果你願意,你可以免費查看分析師對電力整合的預測。
How Are Returns Trending?
退貨趨勢如何?
In terms of Power Integrations' historical ROCE movements, the trend isn't fantastic. Over the last five years, returns on capital have decreased to 2.5% from 7.4% five years ago. And considering revenue has dropped while employing more capital, we'd be cautious. If this were to continue, you might be looking at a company that is trying to reinvest for growth but is actually losing market share since sales haven't increased.
就Power Integrations的歷史投資回報率走勢而言,這種趨勢並不理想。在過去五年中,資本回報率從五年前的7.4%降至2.5%。考慮到在僱用更多資本的同時收入有所下降,我們會謹慎行事。如果這種情況繼續下去,你可能會看到一家試圖進行再投資以促進增長,但由於銷售額沒有增加,實際上正在失去市場份額的公司。
What We Can Learn From Power Integrations' ROCE
我們可以從 Power Integrations 的 ROCE 中學到什麼
From the above analysis, we find it rather worrisome that returns on capital and sales for Power Integrations have fallen, meanwhile the business is employing more capital than it was five years ago. In spite of that, the stock has delivered a 33% return to shareholders who held over the last five years. Either way, we aren't huge fans of the current trends and so with that we think you might find better investments elsewhere.
從上述分析來看,我們發現相當令人擔憂的是,Power Integrations的資本回報率和銷售額有所下降,同時該業務使用的資本比五年前還要多。儘管如此,該股爲在過去五年中持股的股東帶來了33%的回報。無論哪種方式,我們都不是當前趨勢的忠實擁護者,因此我們認爲您可能會在其他地方找到更好的投資。
One more thing, we've spotted 1 warning sign facing Power Integrations that you might find interesting.
還有一件事,我們發現了面向 Power Integrations 的 1 個警告標誌,你可能會覺得有趣。
If you want to search for solid companies with great earnings, check out this free list of companies with good balance sheets and impressive returns on equity.
如果你想尋找收益豐厚的穩健公司,可以免費查看這份資產負債表良好且股本回報率可觀的公司名單。
Have feedback on this article? Concerned about the content? Get in touch with us directly. Alternatively, email editorial-team (at) simplywallst.com.
This article by Simply Wall St is general in nature. We provide commentary based on historical data and analyst forecasts only using an unbiased methodology and our articles are not intended to be financial advice. It does not constitute a recommendation to buy or sell any stock, and does not take account of your objectives, or your financial situation. We aim to bring you long-term focused analysis driven by fundamental data. Note that our analysis may not factor in the latest price-sensitive company announcements or qualitative material. Simply Wall St has no position in any stocks mentioned.
對這篇文章有反饋嗎?對內容感到擔憂嗎?請直接聯繫我們。或者,也可以發送電子郵件至編輯團隊 (at) simplywallst.com。
Simply Wall St的這篇文章本質上是籠統的。我們僅使用公正的方法根據歷史數據和分析師的預測提供評論,我們的文章無意作爲財務建議。它不構成買入或賣出任何股票的建議,也沒有考慮到您的目標或財務狀況。我們的目標是爲您提供由基本數據驅動的長期重點分析。請注意,我們的分析可能不考慮最新的價格敏感型公司公告或定性材料。簡而言之,華爾街沒有持有任何上述股票的頭寸。
譯文內容由第三人軟體翻譯。