
Janus Henderson Group (NYSE:JHG) Shareholders Have Earned a 16% CAGR Over the Last Five Years
Janus Henderson Group (NYSE:JHG) Shareholders Have Earned a 16% CAGR Over the Last Five Years
If you buy and hold a stock for many years, you'd hope to be making a profit. Furthermore, you'd generally like to see the share price rise faster than the market. But Janus Henderson Group plc (NYSE:JHG) has fallen short of that second goal, with a share price rise of 62% over five years, which is below the market return. But if you include dividends then the return is market-beating. However, more recent buyers should be happy with the increase of 32% over the last year.
如果你買入並持有股票多年,你希望獲利。此外,您通常希望看到股價的上漲速度快於市場。但是駿利亨德森集團有限公司(紐約證券交易所代碼:JHG)尚未實現第二個目標,股價在五年內上漲了62%,低於市場回報率。但是,如果將股息包括在內,則回報率將超過市場。但是,最近的買家應該對去年增長32%感到滿意。
Now it's worth having a look at the company's fundamentals too, because that will help us determine if the long term shareholder return has matched the performance of the underlying business.
現在也值得一看公司的基本面,因爲這將有助於我們確定長期股東回報是否與基礎業務的表現相匹配。
In his essay The Superinvestors of Graham-and-Doddsville Warren Buffett described how share prices do not always rationally reflect the value of a business. One flawed but reasonable way to assess how sentiment around a company has changed is to compare the earnings per share (EPS) with the share price.
禾倫·巴菲特在他的文章《格雷厄姆和多茲維爾的超級投資者》中描述了股價如何並不總是能合理地反映企業的價值。評估公司情緒變化的一種有缺陷但合理的方法是將每股收益(EPS)與股價進行比較。
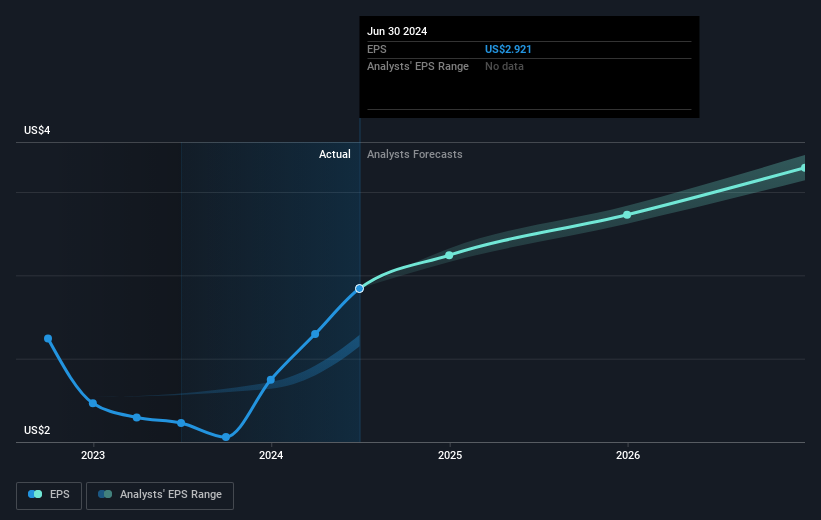
During five years of share price growth, Janus Henderson Group achieved compound earnings per share (EPS) growth of 6.4% per year. This EPS growth is lower than the 10% average annual increase in the share price. So it's fair to assume the market has a higher opinion of the business than it did five years ago. And that's hardly shocking given the track record of growth.
在五年的股價增長中,駿利亨德森集團實現了每年6.4%的複合每股收益(EPS)增長。每股收益的增長低於股價平均年增長10%。因此,可以公平地假設市場對該業務的看法比五年前更高。考慮到增長的記錄,這並不令人震驚。
The company's earnings per share (over time) is depicted in the image below (click to see the exact numbers).
該公司的每股收益(隨着時間的推移)如下圖所示(點擊查看確切數字)。
We know that Janus Henderson Group has improved its bottom line lately, but is it going to grow revenue? If you're interested, you could check this free report showing consensus revenue forecasts.
我們知道駿利亨德森集團最近提高了利潤,但它會增加收入嗎?如果你感興趣,可以查看這份顯示共識收入預測的免費報告。
What About Dividends?
分紅呢?
When looking at investment returns, it is important to consider the difference between total shareholder return (TSR) and share price return. Whereas the share price return only reflects the change in the share price, the TSR includes the value of dividends (assuming they were reinvested) and the benefit of any discounted capital raising or spin-off. It's fair to say that the TSR gives a more complete picture for stocks that pay a dividend. As it happens, Janus Henderson Group's TSR for the last 5 years was 114%, which exceeds the share price return mentioned earlier. The dividends paid by the company have thusly boosted the total shareholder return.
在考慮投資回報時,重要的是要考慮股東總回報(TSR)和股價回報率之間的差異。儘管股價回報率僅反映股價的變化,但股東總回報率包括股息的價值(假設已進行再投資)以及任何折扣融資或分拆的收益。可以公平地說,股東總回報率爲支付股息的股票提供了更完整的畫面。碰巧的是,駿利亨德森集團過去5年的股東總回報率爲114%,超過了前面提到的股價回報率。因此,公司支付的股息提高了股東的總回報率。
A Different Perspective
不同的視角
It's good to see that Janus Henderson Group has rewarded shareholders with a total shareholder return of 39% in the last twelve months. And that does include the dividend. That's better than the annualised return of 16% over half a decade, implying that the company is doing better recently. In the best case scenario, this may hint at some real business momentum, implying that now could be a great time to delve deeper. While it is well worth considering the different impacts that market conditions can have on the share price, there are other factors that are even more important. Take risks, for example - Janus Henderson Group has 1 warning sign we think you should be aware of.
很高興看到駿利亨德森集團在過去十二個月中向股東提供了39%的總股東回報率。這確實包括股息。這比五年來16%的年化回報率要好,這意味着該公司最近的表現更好。在最好的情況下,這可能暗示着一些真正的業務勢頭,這意味着現在可能是深入研究的好時機。儘管市場狀況可能對股價產生的不同影響值得考慮,但還有其他因素更爲重要。例如,冒險吧——駿利亨德森集團有一個警告信號,我們認爲你應該注意。
If you like to buy stocks alongside management, then you might just love this free list of companies. (Hint: many of them are unnoticed AND have attractive valuation).
如果你想和管理層一起購買股票,那麼你可能會喜歡這份免費的公司清單。(提示:其中許多未被注意且估值誘人)。
Please note, the market returns quoted in this article reflect the market weighted average returns of stocks that currently trade on American exchanges.
請注意,本文引用的市場回報反映了目前在美國交易所交易的股票的市場加權平均回報。
Have feedback on this article? Concerned about the content? Get in touch with us directly. Alternatively, email editorial-team (at) simplywallst.com.
This article by Simply Wall St is general in nature. We provide commentary based on historical data and analyst forecasts only using an unbiased methodology and our articles are not intended to be financial advice. It does not constitute a recommendation to buy or sell any stock, and does not take account of your objectives, or your financial situation. We aim to bring you long-term focused analysis driven by fundamental data. Note that our analysis may not factor in the latest price-sensitive company announcements or qualitative material. Simply Wall St has no position in any stocks mentioned.
對這篇文章有反饋嗎?對內容感到擔憂嗎?請直接聯繫我們。或者,也可以發送電子郵件至編輯團隊 (at) simplywallst.com。
Simply Wall St的這篇文章本質上是籠統的。我們僅使用公正的方法根據歷史數據和分析師的預測提供評論,我們的文章無意作爲財務建議。它不構成買入或賣出任何股票的建議,也沒有考慮到您的目標或財務狀況。我們的目標是爲您提供由基本數據驅動的長期重點分析。請注意,我們的分析可能不考慮最新的價格敏感型公司公告或定性材料。簡而言之,華爾街沒有持有任何上述股票的頭寸。
譯文內容由第三人軟體翻譯。