
Plexus (NASDAQ:PLXS) Shareholders Have Earned a 13% CAGR Over the Last Five Years
Plexus (NASDAQ:PLXS) Shareholders Have Earned a 13% CAGR Over the Last Five Years
If you want to compound wealth in the stock market, you can do so by buying an index fund. But in our experience, buying the right stocks can give your wealth a significant boost. For example, the Plexus Corp. (NASDAQ:PLXS) share price is up 88% in the last five years, slightly above the market return. It's also good to see a healthy gain of 31% in the last year.
如果你想在股票市場上增加財富,你可以通過購買指數基金來實現。但是根據我們的經驗,購買合適的股票可以顯著增加您的財富。例如,Plexus公司(納斯達克股票代碼:PLXS)的股價在過去五年中上漲了88%,略高於市場回報率。去年也很高興看到31%的健康增長。
With that in mind, it's worth seeing if the company's underlying fundamentals have been the driver of long term performance, or if there are some discrepancies.
考慮到這一點,值得一看公司的基本面是否是長期業績的驅動力,或者是否存在一些差異。
In his essay The Superinvestors of Graham-and-Doddsville Warren Buffett described how share prices do not always rationally reflect the value of a business. By comparing earnings per share (EPS) and share price changes over time, we can get a feel for how investor attitudes to a company have morphed over time.
禾倫·巴菲特在他的文章《格雷厄姆和多茲維爾的超級投資者》中描述了股價如何並不總是能合理地反映企業的價值。通過比較每股收益(EPS)和股價隨時間推移的變化,我們可以了解投資者對公司的態度如何隨着時間的推移而變化。
Plexus' earnings per share are down 2.7% per year, despite strong share price performance over five years.
儘管五年來股價表現強勁,但Plexus的每股收益每年下降2.7%。
By glancing at these numbers, we'd posit that the decline in earnings per share is not representative of how the business has changed over the years. Since the change in EPS doesn't seem to correlate with the change in share price, it's worth taking a look at other metrics.
通過瀏覽這些數字,我們可以假設每股收益的下降並不能代表業務多年來的變化。由於每股收益的變化似乎與股價的變化無關,因此值得一看其他指標。
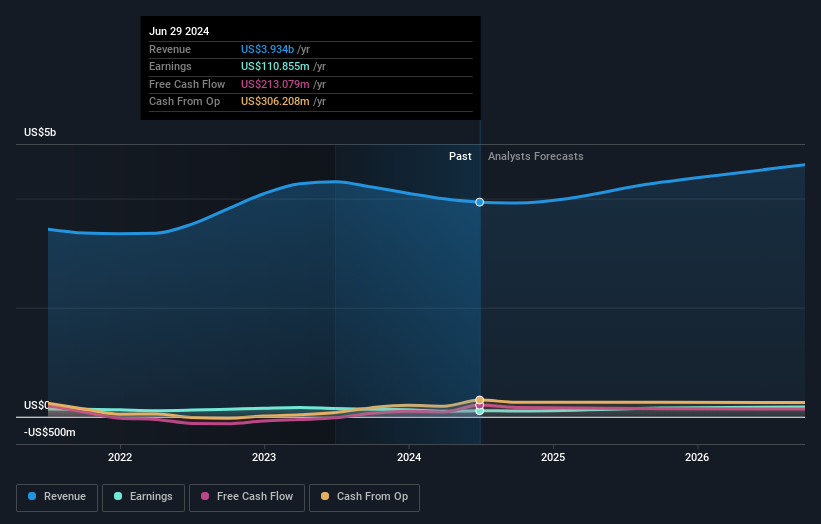
On the other hand, Plexus' revenue is growing nicely, at a compound rate of 6.3% over the last five years. It's quite possible that management are prioritizing revenue growth over EPS growth at the moment.
另一方面,Plexus的收入增長良好,在過去五年中複合增長率爲6.3%。目前,管理層很有可能將收入增長置於每股收益增長之上。
The company's revenue and earnings (over time) are depicted in the image below (click to see the exact numbers).
公司的收入和收益(隨着時間的推移)如下圖所示(點擊查看確切數字)。
This free interactive report on Plexus' balance sheet strength is a great place to start, if you want to investigate the stock further.
如果你想進一步調查該股,這份關於Plexus資產負債表強度的免費互動報告是一個很好的起點。
A Different Perspective
不同的視角
We're pleased to report that Plexus shareholders have received a total shareholder return of 31% over one year. That's better than the annualised return of 13% over half a decade, implying that the company is doing better recently. In the best case scenario, this may hint at some real business momentum, implying that now could be a great time to delve deeper. While it is well worth considering the different impacts that market conditions can have on the share price, there are other factors that are even more important. For instance, we've identified 1 warning sign for Plexus that you should be aware of.
我們很高興地向大家報告,Plexus的股東在一年內獲得了31%的總股東回報率。這比五年來13%的年化回報率要好,這意味着該公司最近的表現更好。在最好的情況下,這可能暗示着一些真正的業務勢頭,這意味着現在可能是深入研究的好時機。儘管市場狀況可能對股價產生的不同影響值得考慮,但還有其他因素更爲重要。例如,我們已經確定了 Plexus 的 1 個警告信號,你應該注意這一點。
But note: Plexus may not be the best stock to buy. So take a peek at this free list of interesting companies with past earnings growth (and further growth forecast).
但請注意:Plexus可能不是最值得購買的股票。因此,來看看這份過去盈利增長(以及進一步增長預測)的有趣公司的免費清單。
Please note, the market returns quoted in this article reflect the market weighted average returns of stocks that currently trade on American exchanges.
請注意,本文引用的市場回報反映了目前在美國交易所交易的股票的市場加權平均回報。
Have feedback on this article? Concerned about the content? Get in touch with us directly. Alternatively, email editorial-team (at) simplywallst.com.
This article by Simply Wall St is general in nature. We provide commentary based on historical data and analyst forecasts only using an unbiased methodology and our articles are not intended to be financial advice. It does not constitute a recommendation to buy or sell any stock, and does not take account of your objectives, or your financial situation. We aim to bring you long-term focused analysis driven by fundamental data. Note that our analysis may not factor in the latest price-sensitive company announcements or qualitative material. Simply Wall St has no position in any stocks mentioned.
對這篇文章有反饋嗎?對內容感到擔憂嗎?請直接聯繫我們。或者,也可以發送電子郵件至編輯團隊 (at) simplywallst.com。
Simply Wall St的這篇文章本質上是籠統的。我們僅使用公正的方法根據歷史數據和分析師的預測提供評論,我們的文章無意作爲財務建議。它不構成買入或賣出任何股票的建議,也沒有考慮到您的目標或財務狀況。我們的目標是爲您提供由基本數據驅動的長期重點分析。請注意,我們的分析可能不考慮最新的價格敏感型公司公告或定性材料。簡而言之,華爾街沒有持有任何上述股票的頭寸。
譯文內容由第三人軟體翻譯。