
Despite the Downward Trend in Earnings at CoStar Group (NASDAQ:CSGP) the Stock Ascends 4.7%, Bringing Five-year Gains to 33%
Despite the Downward Trend in Earnings at CoStar Group (NASDAQ:CSGP) the Stock Ascends 4.7%, Bringing Five-year Gains to 33%
 CoStar Group's earnings per share are down 8.3% per year, despite strong share price performance over five years.
 If you buy and hold a stock for many years, you'd hope to be making a profit. Furthermore, you'd generally like to see the share price rise faster than the market. Unfortunately for shareholders, while the CoStar Group, Inc. (NASDAQ:CSGP) share price is up 33% in the last five years, that's less than the market return. The last year has been disappointing, with the stock price down 2.7% in that time.
如果你買入並持有股票多年,你希望獲利。此外,您通常希望看到股價的上漲速度快於市場。對於股東來說,不幸的是,儘管CoStar集團公司(納斯達克股票代碼:CSGP)的股價在過去五年中上漲了33%,但仍低於市場回報率。去年令人失望,當時股價下跌了2.7%。
On the back of a solid 7-day performance, let's check what role the company's fundamentals have played in driving long term shareholder returns.
在連續7天表現穩健的背景下,讓我們來看看公司的基本面在推動長期股東回報方面發揮了什麼作用。
To paraphrase Benjamin Graham: Over the short term the market is a voting machine, but over the long term it's a weighing machine. One way to examine how market sentiment has changed over time is to look at the interaction between a company's share price and its earnings per share (EPS).
用本傑明·格雷厄姆的話來說:從短期來看,市場是一臺投票機器,但從長遠來看,它是一臺稱重機。研究市場情緒如何隨着時間的推移而變化的一種方法是研究公司股價與其每股收益(EPS)之間的相互作用。
CoStar Group's earnings per share are down 8.3% per year, despite strong share price performance over five years.
儘管五年來股價表現強勁,但CoStar集團的每股收益每年下降8.3%。
This means it's unlikely the market is judging the company based on earnings growth. Because earnings per share don't seem to match up with the share price, we'll take a look at other metrics instead.
這意味着市場不太可能根據收益增長來評判該公司。由於每股收益似乎與股價不符,因此我們將改用其他指標。
On the other hand, CoStar Group's revenue is growing nicely, at a compound rate of 14% over the last five years. It's quite possible that management are prioritizing revenue growth over EPS growth at the moment.
另一方面,CoStar集團的收入增長良好,在過去五年中複合增長率爲14%。目前,管理層很有可能將收入增長置於每股收益增長之上。
The graphic below depicts how earnings and revenue have changed over time (unveil the exact values by clicking on the image).
下圖描述了收入和收入隨時間推移而發生的變化(點擊圖片即可顯示確切的數值)。
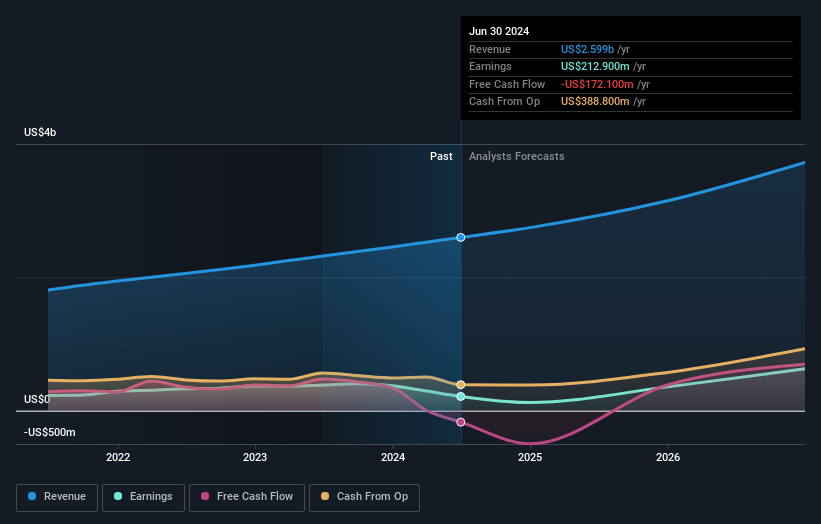
CoStar Group is a well known stock, with plenty of analyst coverage, suggesting some visibility into future growth. Given we have quite a good number of analyst forecasts, it might be well worth checking out this free chart depicting consensus estimates.
CoStar集團是一隻知名股票,分析師報道豐富,這表明未來增長有一定的可見性。鑑於我們有相當多的分析師預測,這張描繪共識估計的免費圖表可能值得一看。
A Different Perspective
不同的視角
While the broader market gained around 22% in the last year, CoStar Group shareholders lost 2.7%. However, keep in mind that even the best stocks will sometimes underperform the market over a twelve month period. Longer term investors wouldn't be so upset, since they would have made 6%, each year, over five years. It could be that the recent sell-off is an opportunity, so it may be worth checking the fundamental data for signs of a long term growth trend. I find it very interesting to look at share price over the long term as a proxy for business performance. But to truly gain insight, we need to consider other information, too. For example, we've discovered 1 warning sign for CoStar Group that you should be aware of before investing here.
去年整體市場上漲了約22%,而CoStar集團的股東卻下跌了2.7%。但是,請記住,即使是最好的股票有時也會在十二個月內表現不如市場。長期投資者不會那麼沮喪,因爲他們本可以在五年內每年賺6%。最近的拋售可能是一個機會,因此可能值得查看基本面數據以尋找長期增長趨勢的跡象。我發現將長期股價視爲業務績效的代表非常有趣。但是,要真正獲得見解,我們還需要考慮其他信息。例如,我們發現了CoStar集團的一個警告信號,在這裏投資之前,您應該注意這一點。
Of course, you might find a fantastic investment by looking elsewhere. So take a peek at this free list of companies we expect will grow earnings.
當然,通過尋找其他地方,你可能會找到一筆不錯的投資。因此,請看一下我們預計收益將增加的這份免費公司名單。
Please note, the market returns quoted in this article reflect the market weighted average returns of stocks that currently trade on American exchanges.
請注意,本文引用的市場回報反映了目前在美國交易所交易的股票的市場加權平均回報。
Have feedback on this article? Concerned about the content? Get in touch with us directly. Alternatively, email editorial-team (at) simplywallst.com.
This article by Simply Wall St is general in nature. We provide commentary based on historical data and analyst forecasts only using an unbiased methodology and our articles are not intended to be financial advice. It does not constitute a recommendation to buy or sell any stock, and does not take account of your objectives, or your financial situation. We aim to bring you long-term focused analysis driven by fundamental data. Note that our analysis may not factor in the latest price-sensitive company announcements or qualitative material. Simply Wall St has no position in any stocks mentioned.
對這篇文章有反饋嗎?對內容感到擔憂嗎?請直接聯繫我們。或者,也可以發送電子郵件至編輯團隊 (at) simplywallst.com。
Simply Wall St的這篇文章本質上是籠統的。我們僅使用公正的方法根據歷史數據和分析師的預測提供評論,我們的文章無意作爲財務建議。它不構成買入或賣出任何股票的建議,也沒有考慮到您的目標或財務狀況。我們的目標是爲您提供由基本數據驅動的長期重點分析。請注意,我們的分析可能不考慮最新的價格敏感型公司公告或定性材料。簡而言之,華爾街沒有持有任何上述股票的頭寸。
譯文內容由第三人軟體翻譯。
