
The Five-year Decline in Earnings for TD SYNNEX NYSE:SNX) Isn't Encouraging, but Shareholders Are Still up 140% Over That Period
The Five-year Decline in Earnings for TD SYNNEX NYSE:SNX) Isn't Encouraging, but Shareholders Are Still up 140% Over That Period
 During five years of share price growth, TD SYNNEX actually saw its EPS drop 1.7% per year.
 TD SYNNEX Corporation (NYSE:SNX) shareholders might be concerned after seeing the share price drop 14% in the last quarter. But the silver lining is the stock is up over five years. In that time, it is up 14%, which isn't bad, but is below the market return of 91%.
道明SYNNEX公司(紐約證券交易所代碼:SNX)股東在看到上個季度股價下跌14%後可能會感到擔憂。但一線希望是該股在五年內上漲。在此期間,它上漲了14%,這還不錯,但低於91%的市場回報率。
Although TD SYNNEX has shed US$893m from its market cap this week, let's take a look at its longer term fundamental trends and see if they've driven returns.
儘管道明SYNNEX本週的市值下跌了8.93億美元,但讓我們來看看其長期基本面趨勢,看看它們是否推動了回報。
While markets are a powerful pricing mechanism, share prices reflect investor sentiment, not just underlying business performance. One way to examine how market sentiment has changed over time is to look at the interaction between a company's share price and its earnings per share (EPS).
雖然市場是一種強大的定價機制,但股價反映了投資者的情緒,而不僅僅是潛在的業務表現。研究市場情緒如何隨着時間的推移而變化的一種方法是研究公司股價與其每股收益(EPS)之間的相互作用。
During five years of share price growth, TD SYNNEX actually saw its EPS drop 1.7% per year.
在股價增長的五年中,TD SYNNEX的每股收益實際上每年下降1.7%。
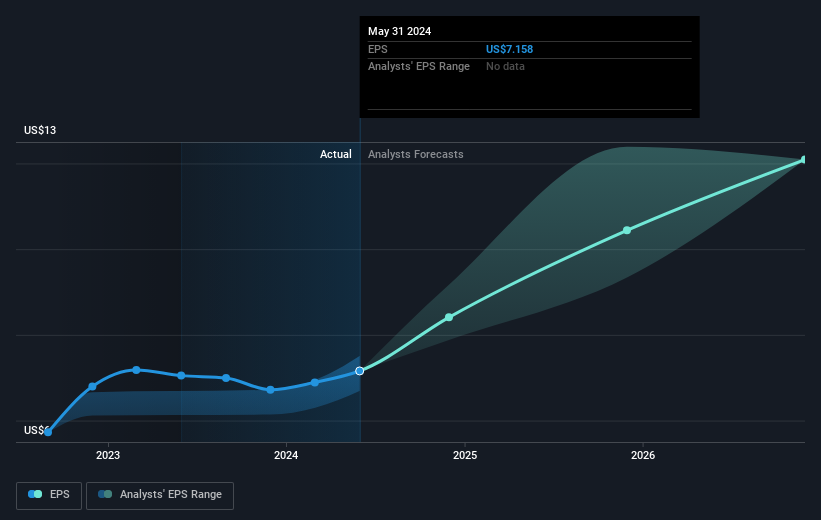
With EPS falling, but a modestly increasing share price, it seems that the market was probably too pessimistic about the stock in the past. Having said that, if the EPS falls continue we'd be surprised to see a sustained increase in share price.
隨着每股收益的下降,但股價略有上漲,過去市場似乎對該股過於悲觀。話雖如此,如果每股收益持續下降,我們會驚訝地看到股價持續上漲。
You can see how EPS has changed over time in the image below (click on the chart to see the exact values).
您可以在下圖中看到 EPS 隨時間推移的變化(點擊圖表查看確切值)。
We're pleased to report that the CEO is remunerated more modestly than most CEOs at similarly capitalized companies. But while CEO remuneration is always worth checking, the really important question is whether the company can grow earnings going forward. Dive deeper into the earnings by checking this interactive graph of TD SYNNEX's earnings, revenue and cash flow.
我們很高興地向大家報告,首席執行官的薪酬比資本相似公司的大多數首席執行官要低得多。但是,儘管首席執行官的薪酬總是值得檢查的,但真正重要的問題是公司未來能否增加收益。查看這張道明SYNNEX收益、收入和現金流的互動圖表,深入了解收益。
What About Dividends?
分紅呢?
When looking at investment returns, it is important to consider the difference between total shareholder return (TSR) and share price return. The TSR is a return calculation that accounts for the value of cash dividends (assuming that any dividend received was reinvested) and the calculated value of any discounted capital raisings and spin-offs. So for companies that pay a generous dividend, the TSR is often a lot higher than the share price return. We note that for TD SYNNEX the TSR over the last 5 years was 140%, which is better than the share price return mentioned above. And there's no prize for guessing that the dividend payments largely explain the divergence!
在考慮投資回報時,重要的是要考慮股東總回報(TSR)和股價回報率之間的差異。股東總回報率是一種回報計算方法,它考慮了現金分紅的價值(假設收到的任何股息都經過再投資)以及任何貼現資本籌集和分拆的計算價值。因此,對於支付豐厚股息的公司來說,股東總回報率通常遠高於股價回報率。我們注意到,TD SYNNEX在過去5年的股東總回報率爲140%,好於上述股價回報率。而且,猜測股息支付在很大程度上解釋了這種分歧是沒有好處的!
A Different Perspective
不同的視角
TD SYNNEX shareholders are up 14% for the year (even including dividends). Unfortunately this falls short of the market return. On the bright side, the longer term returns (running at about 19% a year, over half a decade) look better. Maybe the share price is just taking a breather while the business executes on its growth strategy. I find it very interesting to look at share price over the long term as a proxy for business performance. But to truly gain insight, we need to consider other information, too. For example, we've discovered 1 warning sign for TD SYNNEX that you should be aware of before investing here.
道明SYNNEX的股東今年增長了14%(甚至包括股息)。不幸的是,這沒有達到市場回報率。好的一面是,長期回報(超過五年,每年約19%)看起來更好。也許在企業執行增長戰略的同時,股價只是在稍作休息。我發現將長期股價視爲業務績效的代表非常有趣。但是,要真正獲得見解,我們還需要考慮其他信息。例如,我們發現了TD SYNNEX的1個警告信號,在這裏投資之前,您應該注意這一點。
If you like to buy stocks alongside management, then you might just love this free list of companies. (Hint: many of them are unnoticed AND have attractive valuation).
如果你想和管理層一起購買股票,那麼你可能會喜歡這份免費的公司清單。(提示:其中許多未被注意且估值誘人)。
Please note, the market returns quoted in this article reflect the market weighted average returns of stocks that currently trade on American exchanges.
請注意,本文引用的市場回報反映了目前在美國交易所交易的股票的市場加權平均回報。
Have feedback on this article? Concerned about the content? Get in touch with us directly. Alternatively, email editorial-team (at) simplywallst.com.
This article by Simply Wall St is general in nature. We provide commentary based on historical data and analyst forecasts only using an unbiased methodology and our articles are not intended to be financial advice. It does not constitute a recommendation to buy or sell any stock, and does not take account of your objectives, or your financial situation. We aim to bring you long-term focused analysis driven by fundamental data. Note that our analysis may not factor in the latest price-sensitive company announcements or qualitative material. Simply Wall St has no position in any stocks mentioned.
對這篇文章有反饋嗎?對內容感到擔憂嗎?請直接聯繫我們。或者,也可以發送電子郵件至編輯團隊 (at) simplywallst.com。
Simply Wall St的這篇文章本質上是籠統的。我們僅使用公正的方法根據歷史數據和分析師的預測提供評論,我們的文章無意作爲財務建議。它不構成買入或賣出任何股票的建議,也沒有考慮到您的目標或財務狀況。我們的目標是爲您提供由基本數據驅動的長期重點分析。請注意,我們的分析可能不考慮最新的價格敏感型公司公告或定性材料。簡而言之,華爾街沒有持有任何上述股票的頭寸。
譯文內容由第三人軟體翻譯。
