
MarineMax (NYSE:HZO) Sheds 8.4% This Week, as Yearly Returns Fall More in Line With Earnings Growth
MarineMax (NYSE:HZO) Sheds 8.4% This Week, as Yearly Returns Fall More in Line With Earnings Growth
 Over half a decade, MarineMax managed to grow its earnings per share at 4.1% a year. This EPS growth is lower than the 14% average annual increase in the share price. So it's fair to assume the market has a higher opinion of the business than it did five years ago. And that's hardly shocking given the track record of growth.
 MarineMax, Inc. (NYSE:HZO) shareholders might be concerned after seeing the share price drop 15% in the last quarter. But at least the stock is up over the last five years. Unfortunately its return of 91% is below the market return of 91%. Unfortunately not all shareholders will have held it for five years, so spare a thought for those caught in the 39% decline over the last three years: that's a long time to wait for profits.
海上麥斯服務, Inc.(紐交所:HZO)的股東們可能會擔心,在過去一個季度,股價下跌了15%。 但至少股票在過去五年中上漲了。 不幸的是,其回報率爲91%,低於市場回報率91%。 不幸的是,並非所有股東都會持有它五年,所以請爲過去三年中39%的下跌而想一想:那是漫長的等待利潤的時間。
While this past week has detracted from the company's five-year return, let's look at the recent trends of the underlying business and see if the gains have been in alignment.
雖然過去的一週削弱了公司的五年回報,但讓我們看看業務的最近趨勢,並查看收益是否已對齊。
To paraphrase Benjamin Graham: Over the short term the market is a voting machine, but over the long term it's a weighing machine. One way to examine how market sentiment has changed over time is to look at the interaction between a company's share price and its earnings per share (EPS).
用本傑明·格雷厄姆的話來說:「短期市場是一臺投票機,但長期市場是一臺稱重機」。檢查市場情緒如何隨時間推移變化的一種方式是查看公司股價和每股收益(EPS)之間的相互作用。
Over half a decade, MarineMax managed to grow its earnings per share at 4.1% a year. This EPS growth is lower than the 14% average annual increase in the share price. So it's fair to assume the market has a higher opinion of the business than it did five years ago. And that's hardly shocking given the track record of growth.
在半個十年中,海上麥斯服務成功以每股收益4.1%的年增長率增長。該每股收益增長低於股價的平均年增長率14%。所以可以合理地認爲市場對該業務的看法比五年前更高。考慮到增長的歷史記錄,這並不令人震驚。
You can see how EPS has changed over time in the image below (click on the chart to see the exact values).
您可以在下面的圖片中查看每股收益如何隨時間變化(單擊圖表以查看確切的價值)。
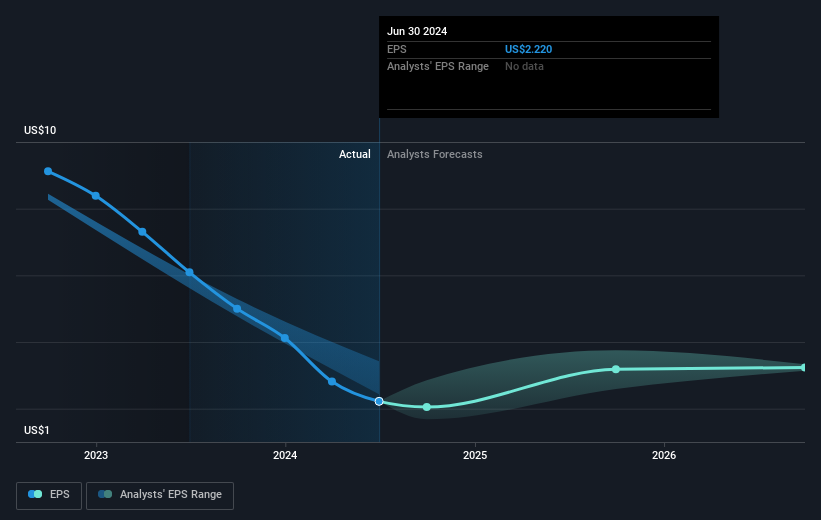
Dive deeper into MarineMax's key metrics by checking this interactive graph of MarineMax's earnings, revenue and cash flow.
通過查看這個互動圖表,進一步了解海上麥斯服務的關鍵指標,包括營業收入、收益和現金流。
A Different Perspective
不同的觀點
MarineMax shareholders are down 7.3% for the year, but the market itself is up 21%. Even the share prices of good stocks drop sometimes, but we want to see improvements in the fundamental metrics of a business, before getting too interested. Longer term investors wouldn't be so upset, since they would have made 14%, each year, over five years. If the fundamental data continues to indicate long term sustainable growth, the current sell-off could be an opportunity worth considering. While it is well worth considering the different impacts that market conditions can have on the share price, there are other factors that are even more important. For example, we've discovered 3 warning signs for MarineMax (1 is concerning!) that you should be aware of before investing here.
海上麥斯服務的股東今年虧損了7.3%,但市場本身上漲了21%。即使好股票的股價有時會下跌,但我們希望在產業基本指標有所改善之前不要過於關注。從長期投資者的角度來看,他們不會那麼沮喪,因爲他們每年可以獲得14%的回報,連續五年。如果基本數據繼續顯示出長期可持續增長,當前的拋售可能是一個值得考慮的機會。雖然考慮市場條件對股價的不同影響是非常值得的,但還有其他更重要的因素。例如,在投資這裏之前,我們發現了3個警示信號(其中1個令人擔憂!),你應該注意。
Of course, you might find a fantastic investment by looking elsewhere. So take a peek at this free list of companies we expect will grow earnings.
當然,您可能在其他地方找到一家出色的企業進行投資。因此,請查看我們預計將實現盈利增長的公司的免費列表。
Please note, the market returns quoted in this article reflect the market weighted average returns of stocks that currently trade on American exchanges.
請注意,本文所引述的市場回報反映了目前在美國交易所上市的股票的市場加權平均回報。
Have feedback on this article? Concerned about the content? Get in touch with us directly. Alternatively, email editorial-team (at) simplywallst.com.
This article by Simply Wall St is general in nature. We provide commentary based on historical data and analyst forecasts only using an unbiased methodology and our articles are not intended to be financial advice. It does not constitute a recommendation to buy or sell any stock, and does not take account of your objectives, or your financial situation. We aim to bring you long-term focused analysis driven by fundamental data. Note that our analysis may not factor in the latest price-sensitive company announcements or qualitative material. Simply Wall St has no position in any stocks mentioned.
對本文有任何反饋?對內容有任何疑慮?請直接與我們聯繫。或者,發送電子郵件至editorial-team@simplywallst.com。
這篇文章是Simply Wall St的一般性文章。我們根據歷史數據和分析師預測提供評論,只使用公正的方法論,我們的文章並不意味着提供任何金融建議。文章不構成買賣任何股票的建議,也不考慮您的目標或您的財務狀況。我們的目標是帶給您基本數據驅動的長期關注分析。請注意,我們的分析可能不考慮最新的價格敏感公司公告或定性材料。Simply Wall St沒有任何股票頭寸。
譯文內容由第三人軟體翻譯。
