
Altice USA's (NYSE:ATUS) Returns Have Hit A Wall
Altice USA's (NYSE:ATUS) Returns Have Hit A Wall
If we want to find a potential multi-bagger, often there are underlying trends that can provide clues. In a perfect world, we'd like to see a company investing more capital into its business and ideally the returns earned from that capital are also increasing. This shows us that it's a compounding machine, able to continually reinvest its earnings back into the business and generate higher returns. However, after investigating Altice USA (NYSE:ATUS), we don't think it's current trends fit the mold of a multi-bagger.
如果我們想找到潛在的暴利股,通常有一些潛在趨勢可以提供線索。在一個完美的世界中,我們希望看到公司將更多資本投入到業務中,而且理想情況下,從該資本獲得的回報也在增加。這向我們表明這是一個複利機器,能夠不斷將盈利重新投資到業務中,併產生更高的回報。然而,經過對Altice USA (NYSE:ATUS) 的調查後,我們認爲它的當前趨勢並不符合暴利股的模式。
Understanding Return On Capital Employed (ROCE)
上面您可以看到蒙托克可再生能源現行ROCE與之前資本回報的比較,但過去只能知道這麼多。如果您感興趣,可以查看我們免費的蒙托克可再生能源分析師報告,了解分析師的預測。
If you haven't worked with ROCE before, it measures the 'return' (pre-tax profit) a company generates from capital employed in its business. To calculate this metric for Altice USA, this is the formula:
如果您以前沒有使用過ROCE,它衡量公司從業務中使用的資本中產生的「回報」(稅前利潤)。要爲Altice USA計算這個指標,可以使用以下公式:
Return on Capital Employed = Earnings Before Interest and Tax (EBIT) ÷ (Total Assets - Current Liabilities)
資產僱用回報率(ROCE)是指企業利潤,即企業稅前利潤除以企業投入的總資本(負債加股權)。如果ROCE高於企業財務成本的承受能力,那麼企業就會創造出更多的價值。
0.063 = US$1.9b ÷ (US$32b - US$2.2b) (Based on the trailing twelve months to June 2024).
0.063 = 19億美元 ÷ (320億美元 - 22億美元)(截至2024年6月的過去十二個月)。
Therefore, Altice USA has an ROCE of 6.3%. Ultimately, that's a low return and it under-performs the Media industry average of 9.7%.
因此,Altice USA的ROCE爲6.3%。最終,這是一個較低的回報,並且低於媒體行業平均水平9.7%。
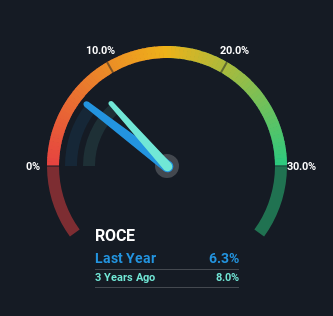
Above you can see how the current ROCE for Altice USA compares to its prior returns on capital, but there's only so much you can tell from the past. If you'd like to see what analysts are forecasting going forward, you should check out our free analyst report for Altice USA .
從上面可以看到,Altice USA目前的ROCE與其以往的資本回報相比如何,但從過去只能了解到有限的信息。如果您想了解分析師們對未來的預測,您應該查看我們提供的Altice USA的免費分析師報告。
How Are Returns Trending?
綜合上述,Cimpress非常有效地提高了其資本利用率所產生的回報。考慮到股票過去五年保持穩定,如果其他指標也不錯,則可能存在機會。因此,進一步研究這家公司並確定這些趨勢是否會持續是合理的。
There hasn't been much to report for Altice USA's returns and its level of capital employed because both metrics have been steady for the past five years. It's not uncommon to see this when looking at a mature and stable business that isn't re-investing its earnings because it has likely passed that phase of the business cycle. With that in mind, unless investment picks up again in the future, we wouldn't expect Altice USA to be a multi-bagger going forward.
在過去的五年裏,Altice USA的回報和資本使用水平都保持穩定,因此沒有太多可以報告的。當查看一個成熟和穩定的企業時,如果它不再將收益進行再投資,這種情況並不罕見,因爲它很可能已經過了企業週期的那個階段。考慮到這一點,除非未來再次進行投資,否則我們不希望Altice USA未來能夠成爲一個多倍投資者。
The Key Takeaway
重要提示
In a nutshell, Altice USA has been trudging along with the same returns from the same amount of capital over the last five years. And investors may be expecting the fundamentals to get a lot worse because the stock has crashed 93% over the last five years. All in all, the inherent trends aren't typical of multi-baggers, so if that's what you're after, we think you might have more luck elsewhere.
簡而言之,Altice USA在過去的五年裏一直保持着相同的回報率和相同的資本使用量。投資者可能希望基本面會變得更糟,因爲該股票在過去五年中下跌了93%。總而言之,這種內在的趨勢並不是多倍投資者的典型特徵,所以如果您在尋找這樣的股票,我們認爲您在其他地方可能會更有運氣。
Since virtually every company faces some risks, it's worth knowing what they are, and we've spotted 4 warning signs for Altice USA (of which 2 make us uncomfortable!) that you should know about.
由於幾乎每個公司都面臨一些風險,了解這些風險是值得的。我們發現Altice USA有4個警示信號(其中有2個讓我們感到不舒服!)你應該了解一下。
For those who like to invest in solid companies, check out this free list of companies with solid balance sheets and high returns on equity.
Hao Tian International Construction Investment Group確實存在一些風險,我們已經發現了一條警示標誌,你可能會感興趣。對於那些喜歡投資於實力雄厚的公司的人,可以查看這個由財務狀況強大、股本回報率高的公司組成的免費列表。
Have feedback on this article? Concerned about the content? Get in touch with us directly. Alternatively, email editorial-team (at) simplywallst.com.
This article by Simply Wall St is general in nature. We provide commentary based on historical data and analyst forecasts only using an unbiased methodology and our articles are not intended to be financial advice. It does not constitute a recommendation to buy or sell any stock, and does not take account of your objectives, or your financial situation. We aim to bring you long-term focused analysis driven by fundamental data. Note that our analysis may not factor in the latest price-sensitive company announcements or qualitative material. Simply Wall St has no position in any stocks mentioned.
對本文有任何反饋?對內容有任何疑慮?請直接與我們聯繫。或者,發送電子郵件至editorial-team@simplywallst.com。
這篇文章是Simply Wall St的一般性文章。我們根據歷史數據和分析師預測提供評論,只使用公正的方法論,我們的文章並不意味着提供任何金融建議。文章不構成買賣任何股票的建議,也不考慮您的目標或您的財務狀況。我們的目標是帶給您基本數據驅動的長期關注分析。請注意,我們的分析可能不考慮最新的價格敏感公司公告或定性材料。Simply Wall St沒有任何股票頭寸。
譯文內容由第三人軟體翻譯。