
Ovintiv (NYSE:OVV) Is Experiencing Growth In Returns On Capital
Ovintiv (NYSE:OVV) Is Experiencing Growth In Returns On Capital
What are the early trends we should look for to identify a stock that could multiply in value over the long term? One common approach is to try and find a company with returns on capital employed (ROCE) that are increasing, in conjunction with a growing amount of capital employed. Basically this means that a company has profitable initiatives that it can continue to reinvest in, which is a trait of a compounding machine. So on that note, Ovintiv (NYSE:OVV) looks quite promising in regards to its trends of return on capital.
我們應該關注哪些早期趨勢,以找到一個能在長期內增值的股票?一種常見的方法是尋找ROCE(資本僱用回報率)逐漸增加且資本僱用量增加的公司。基本上,這意味着公司有利潤豐厚的倡議,並且可以繼續進行再投資,這是一個複利機器的特徵。所以在這一點上,Ovintiv(紐交所:OVV)在資本回報趨勢方面看起來非常有前途。
Understanding Return On Capital Employed (ROCE)
上面您可以看到蒙托克可再生能源現行ROCE與之前資本回報的比較,但過去只能知道這麼多。如果您感興趣,可以查看我們免費的蒙托克可再生能源分析師報告,了解分析師的預測。
If you haven't worked with ROCE before, it measures the 'return' (pre-tax profit) a company generates from capital employed in its business. To calculate this metric for Ovintiv, this is the formula:
如果您以前沒有接觸過ROCE,它衡量了一家公司從其業務中使用的資本獲得的「回報」(稅前利潤)。爲了計算Ovintiv的這個指標,使用了以下公式:
Return on Capital Employed = Earnings Before Interest and Tax (EBIT) ÷ (Total Assets - Current Liabilities)
資產僱用回報率(ROCE)是指企業利潤,即企業稅前利潤除以企業投入的總資本(負債加股權)。如果ROCE高於企業財務成本的承受能力,那麼企業就會創造出更多的價值。
0.16 = US$2.7b ÷ (US$20b - US$3.2b) (Based on the trailing twelve months to June 2024).
0.16 = 27億美元 ÷ (200億美元 - 3.2億美元)(基於追溯的最近十二個月至2024年6月)。
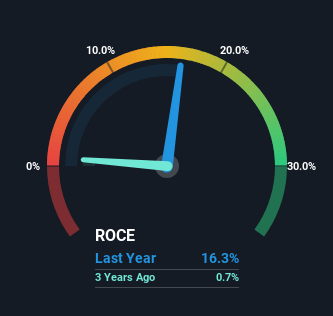
Therefore, Ovintiv has an ROCE of 16%. In absolute terms, that's a satisfactory return, but compared to the Oil and Gas industry average of 12% it's much better.
因此,Ovintiv的ROCE爲16%。從絕對值來看,這是一個令人滿意的回報,但與石油天然氣行業平均水平12%相比,要好得多。
In the above chart we have measured Ovintiv's prior ROCE against its prior performance, but the future is arguably more important. If you'd like, you can check out the forecasts from the analysts covering Ovintiv for free.
在上面的圖表中,我們對Ovintiv之前的ROCE與其之前的表現進行了測量,但未來可能更爲重要。如果您願意,可以免費查看覆蓋Ovintiv的分析師預測。
The Trend Of ROCE
當尋找下一個倍增器時,如果您不確定從哪裏開始,請關注幾個關鍵趨勢。首先,我們希望看到一個經過驗證的資本使用率。如果您看到這一點,通常意味着這是一家擁有出色業務模式和大量盈利再投資機會的公司。然而,調查蒙托克可再生能源公司(NASDAQ:MNTK)後,我們認爲它的現行趨勢不符合倍增器的模式。
Ovintiv has not disappointed with their ROCE growth. The figures show that over the last five years, ROCE has grown 65% whilst employing roughly the same amount of capital. Basically the business is generating higher returns from the same amount of capital and that is proof that there are improvements in the company's efficiencies. On that front, things are looking good so it's worth exploring what management has said about growth plans going forward.
Ovintiv的ROCE增長令人滿意。數據顯示,在過去五年中,ROCE增長了65%,同時使用了大致相同的資本。基本上,業務從相同的資本中產生了更高的回報,這證明了公司效率的提高。在這方面,情況看起來不錯,因此值得探索一下管理層對未來增長計劃的看法。
The Bottom Line On Ovintiv's ROCE
關於Ovintiv的ROCE的結論
As discussed above, Ovintiv appears to be getting more proficient at generating returns since capital employed has remained flat but earnings (before interest and tax) are up. And with the stock having performed exceptionally well over the last five years, these patterns are being accounted for by investors. Therefore, we think it would be worth your time to check if these trends are going to continue.
如上所述,由於使用的資本保持不變而收入(利息和稅前)上漲,Ovintiv似乎在產生回報方面變得更加熟練。而且,在過去五年中,股票表現異常出色,投資者已經納入了這些模式。因此,我們認爲值得您花時間來查看這些趨勢是否會持續下去。
If you'd like to know about the risks facing Ovintiv, we've discovered 3 warning signs that you should be aware of.
如果您想了解Ovintiv面臨的風險,我們發現了3個警示信號,您應該注意。
If you want to search for solid companies with great earnings, check out this free list of companies with good balance sheets and impressive returns on equity.
如果您想尋找財務狀況良好、回報卓越的實力強企業,可以免費查看以下公司列表。
Have feedback on this article? Concerned about the content? Get in touch with us directly. Alternatively, email editorial-team (at) simplywallst.com.
This article by Simply Wall St is general in nature. We provide commentary based on historical data and analyst forecasts only using an unbiased methodology and our articles are not intended to be financial advice. It does not constitute a recommendation to buy or sell any stock, and does not take account of your objectives, or your financial situation. We aim to bring you long-term focused analysis driven by fundamental data. Note that our analysis may not factor in the latest price-sensitive company announcements or qualitative material. Simply Wall St has no position in any stocks mentioned.
對本文有任何反饋?對內容有任何疑慮?請直接與我們聯繫。或者,發送電子郵件至editorial-team@simplywallst.com。
這篇文章是Simply Wall St的一般性文章。我們根據歷史數據和分析師預測提供評論,只使用公正的方法論,我們的文章並不意味着提供任何金融建議。文章不構成買賣任何股票的建議,也不考慮您的目標或您的財務狀況。我們的目標是帶給您基本數據驅動的長期關注分析。請注意,我們的分析可能不考慮最新的價格敏感公司公告或定性材料。Simply Wall St沒有任何股票頭寸。
譯文內容由第三人軟體翻譯。