
Ryerson Holding Corporation (NYSE:RYI) Shares Could Be 26% Above Their Intrinsic Value Estimate
Ryerson Holding Corporation (NYSE:RYI) Shares Could Be 26% Above Their Intrinsic Value Estimate
Key Insights
主要見解
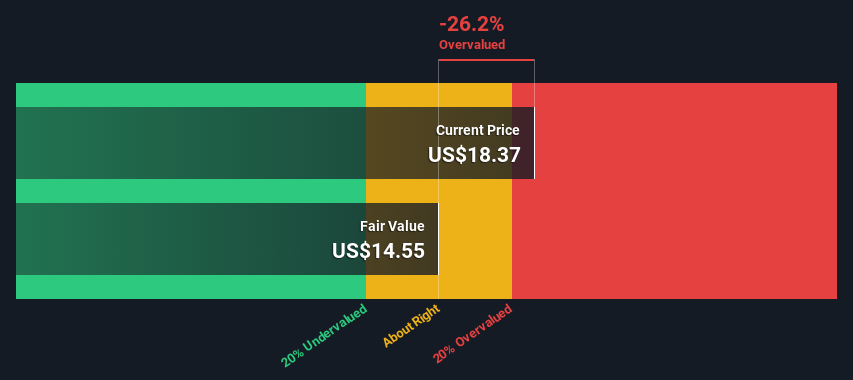
- Ryerson Holding's estimated fair value is US$14.55 based on Dividend Discount Model
- Current share price of US$18.37 suggests Ryerson Holding is potentially 26% overvalued
- ryerson控股的估計公允價值爲14.55美元,基於股息折現模型
- 以18.37美元的當前股價來看,ryerson控股有可能被高估了26%
Does the September share price for Ryerson Holding Corporation (NYSE:RYI) reflect what it's really worth? Today, we will estimate the stock's intrinsic value by taking the forecast future cash flows of the company and discounting them back to today's value. We will use the Discounted Cash Flow (DCF) model on this occasion. Before you think you won't be able to understand it, just read on! It's actually much less complex than you'd imagine.
九月份的股價反映了ryerson控股公司(NYSE:RYI)的真實價值嗎?今天,我們將通過對公司未來現金流量的預測,並將其貼現爲今天的價值,來估算該股票的內在價值。這次我們將使用貼現現金流(DCF)模型。在你認爲自己無法理解之前,先讀下去!實際上,它比你想象的要簡單得多。
Companies can be valued in a lot of ways, so we would point out that a DCF is not perfect for every situation. For those who are keen learners of equity analysis, the Simply Wall St analysis model here may be something of interest to you.
公司的估值有很多方式,所以我們會指出DCF並非適用於每種情況。如果你是股票分析的狂熱者,可以考慮嘗試Simply Wall Street的分析模型。
The Calculation
計算方法
As Ryerson Holding operates in the metals and mining sector, we need to calculate the intrinsic value slightly differently. In this approach dividends per share (DPS) are used, as free cash flow is difficult to estimate and often not reported by analysts. This often underestimates the value of a stock, but it can still be good as a comparison to competitors. The 'Gordon Growth Model' is used, which simply assumes that dividend payments will continue to increase at a sustainable growth rate forever. The dividend is expected to grow at an annual growth rate equal to the 5-year average of the 10-year government bond yield of 2.5%. We then discount this figure to today's value at a cost of equity of 7.7%. Relative to the current share price of US$18.4, the company appears slightly overvalued at the time of writing. The assumptions in any calculation have a big impact on the valuation, so it is better to view this as a rough estimate, not precise down to the last cent.
由於Ryerson Holding業務主要在金屬和採礦行業,因此我們需要稍微不同地計算內在價值。在這種方法中,使用每股股息(DPS),因爲自由現金流很難估計,通常分析師也不會報告。這往往低估了股票的價值,但可以用來與競爭對手進行比較。我們使用的是「戈登成長模型」,它簡單地假設分紅支付將以持續增長率不斷增加。預計分紅將以2.5%的10年期政府債券收益率的5年平均增長率增長。然後,我們按照7.7%的權益成本對這個數字進行貼現,得出今天的價值。以目前的股價18.4美元來看,在撰寫本文時,公司似乎稍微被高估了。任何計算中的假設對估值有很大影響,因此最好將其視爲粗略估計,而不是精確到最後一分錢。
Value Per Share = Expected Dividend Per Share / (Discount Rate - Perpetual Growth Rate)
每股股息 = 預期每股股息 / (折現率-永久增長率)
= US$0.8 / (7.7% – 2.5%)
= 0.8美元 / (7.7% - 2.5%)
= US$14.6
= 14.6美元
The Assumptions
假設
Now the most important inputs to a discounted cash flow are the discount rate, and of course, the actual cash flows. If you don't agree with these result, have a go at the calculation yourself and play with the assumptions. The DCF also does not consider the possible cyclicality of an industry, or a company's future capital requirements, so it does not give a full picture of a company's potential performance. Given that we are looking at Ryerson Holding as potential shareholders, the cost of equity is used as the discount rate, rather than the cost of capital (or weighted average cost of capital, WACC) which accounts for debt. In this calculation we've used 7.7%, which is based on a levered beta of 1.251. Beta is a measure of a stock's volatility, compared to the market as a whole. We get our beta from the industry average beta of globally comparable companies, with an imposed limit between 0.8 and 2.0, which is a reasonable range for a stable business.
現在貼現現金流最重要的輸入是貼現率,當然,還有實際現金流。如果你不同意這些結果,可以自己進行計算並調整假設。DCF模型也不考慮行業的可能週期性,或者公司未來的資本需求,因此不能完全展現公司潛力。考慮到我們正在研究Ryerson Holding作爲潛在股東,使用的貼現率是權益成本,而不是成本資本(或加權平均資本成本,WACC),後者考慮了債務。在這個計算中,我們使用了7.7%,這是基於槓桿貝塔1.251來的。貝塔是股票相對於整個市場的波動性的度量。我們從全球可比公司的行業平均貝塔獲得我們的貝塔,強制限制在0.8到2.0之間,這是一個穩定業務的合理範圍。
Looking Ahead:
展望未來:
Although the valuation of a company is important, it is only one of many factors that you need to assess for a company. It's not possible to obtain a foolproof valuation with a DCF model. Rather it should be seen as a guide to "what assumptions need to be true for this stock to be under/overvalued?" For example, changes in the company's cost of equity or the risk free rate can significantly impact the valuation. Why is the intrinsic value lower than the current share price? For Ryerson Holding, there are three essential elements you should assess:
雖然一家公司的估值很重要,但它只是評估一家公司所需考慮的衆多因素之一。用DCF模型無法獲得百分之百準確的估值。相反,它應該被視爲「爲使得該股票被高估/低估,哪些假設需要成立?」的指南。例如,公司權益成本或無風險利率的變化可能會對估值產生重大影響。爲什麼內在價值低於當前股價?對於Ryerson Holding來說,有三個重要的要素需要評估:
- Risks: We feel that you should assess the 3 warning signs for Ryerson Holding we've flagged before making an investment in the company.
- Future Earnings: How does RYI's growth rate compare to its peers and the wider market? Dig deeper into the analyst consensus number for the upcoming years by interacting with our free analyst growth expectation chart.
- Other High Quality Alternatives: Do you like a good all-rounder? Explore our interactive list of high quality stocks to get an idea of what else is out there you may be missing!
- 風險:在投資該公司之前,我們認爲你應該評估Ryerson Holding的三個警示跡象。
- 未來收益:RYI的增長率與同行及更廣泛的市場相比如何?通過與我們的免費分析師增長預期圖互動,進一步了解未來幾年的分析師共識數據。
- 其他高質量選擇:你喜歡一個好的多面手嗎?瀏覽我們的高質量股票交互列表,了解還有哪些你可能錯過的好東西!
PS. Simply Wall St updates its DCF calculation for every American stock every day, so if you want to find the intrinsic value of any other stock just search here.
PS. Simply Wall St每天都會更新其對每隻美國股票的折現現金流計算,因此,如果你想找到其他股票的內在價值,只需在此搜索即可。
Have feedback on this article? Concerned about the content? Get in touch with us directly. Alternatively, email editorial-team (at) simplywallst.com.
This article by Simply Wall St is general in nature. We provide commentary based on historical data and analyst forecasts only using an unbiased methodology and our articles are not intended to be financial advice. It does not constitute a recommendation to buy or sell any stock, and does not take account of your objectives, or your financial situation. We aim to bring you long-term focused analysis driven by fundamental data. Note that our analysis may not factor in the latest price-sensitive company announcements or qualitative material. Simply Wall St has no position in any stocks mentioned.
對本文有任何反饋?對內容有任何疑慮?請直接與我們聯繫。或者,發送電子郵件至editorial-team@simplywallst.com。
這篇文章是Simply Wall St的一般性文章。我們根據歷史數據和分析師預測提供評論,只使用公正的方法論,我們的文章並不意味着提供任何金融建議。文章不構成買賣任何股票的建議,也不考慮您的目標或您的財務狀況。我們的目標是帶給您基本數據驅動的長期關注分析。請注意,我們的分析可能不考慮最新的價格敏感公司公告或定性材料。Simply Wall St沒有任何股票頭寸。
譯文內容由第三人軟體翻譯。