
Is CBRE Group (NYSE:CBRE) Using Too Much Debt?
Is CBRE Group (NYSE:CBRE) Using Too Much Debt?
Legendary fund manager Li Lu (who Charlie Munger backed) once said, 'The biggest investment risk is not the volatility of prices, but whether you will suffer a permanent loss of capital.' So it seems the smart money knows that debt - which is usually involved in bankruptcies - is a very important factor, when you assess how risky a company is. Importantly, CBRE Group, Inc. (NYSE:CBRE) does carry debt. But should shareholders be worried about its use of debt?
傳奇基金經理李錄(Charlie Munger支持)曾經說過:「最大的投資風險不是價格的波動,而是資本是否會遭受永久性損失。」因此,可見聰明的投資者知道,債務(通常與破產有關)是評估一家公司風險程度時至關重要的因素。重要的是,世邦魏理仕集團(NYSE:CBRE)確實存在債務。但是,股東們應該擔心它使用債務嗎?
Why Does Debt Bring Risk?
爲什麼債務會帶來風險?
Debt is a tool to help businesses grow, but if a business is incapable of paying off its lenders, then it exists at their mercy. In the worst case scenario, a company can go bankrupt if it cannot pay its creditors. However, a more usual (but still expensive) situation is where a company must dilute shareholders at a cheap share price simply to get debt under control. Having said that, the most common situation is where a company manages its debt reasonably well - and to its own advantage. The first step when considering a company's debt levels is to consider its cash and debt together.
債務是幫助企業成長的工具,但是,如果企業無力償還其債權人,則企業存在於債權人的掌控之中。 最壞的情況下,如果企業無法償還其債權人,它可能會破產。 然而,更常見的(但仍然昂貴)情況是,企業必須以低廉的價格稀釋股東的股份,以便控制債務。 也就是說,最常見的情況是,企業合理地管理其債務,使其受益。 在考慮一家公司的債務水平時,第一步是考慮其現金和債務的總體情況。
How Much Debt Does CBRE Group Carry?
世邦魏理仕集團承擔了多少債務?
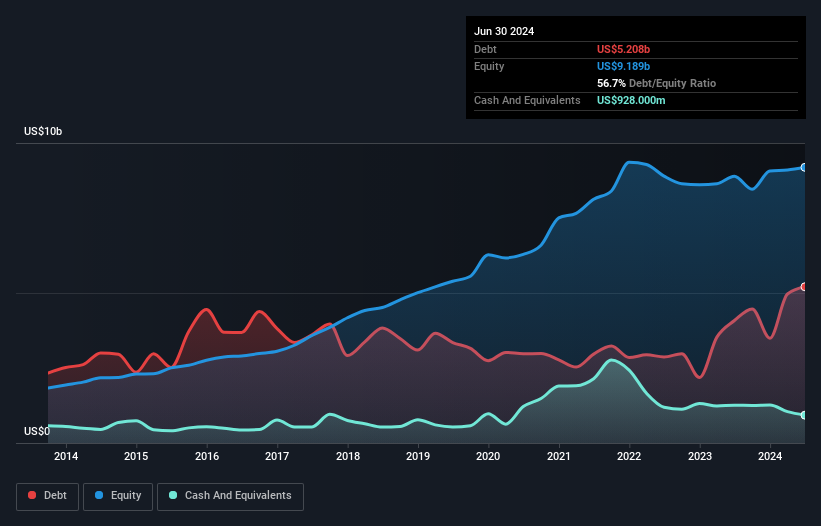
You can click the graphic below for the historical numbers, but it shows that as of June 2024 CBRE Group had US$5.21b of debt, an increase on US$4.08b, over one year. However, it does have US$928.0m in cash offsetting this, leading to net debt of about US$4.28b.
您可以點擊下方的圖表查看歷史數字,但它顯示,截至2024年6月,世邦魏理仕集團擁有52.1億美元的債務,相比去年的40.8億美元有所增加。然而,它有9,2800萬美元的現金來抵消這筆債務,從而形成約42.8億美元的淨債務。
A Look At CBRE Group's Liabilities
CBRE Group的負債情況分析
The latest balance sheet data shows that CBRE Group had liabilities of US$8.63b due within a year, and liabilities of US$5.64b falling due after that. Offsetting this, it had US$928.0m in cash and US$6.95b in receivables that were due within 12 months. So it has liabilities totalling US$6.40b more than its cash and near-term receivables, combined.
最新資產負債表數據顯示,CBRE Group有863億美元的短期債務,還有564億美元的長期債務。而它的現金流動性資產爲9280萬美元,應收賬款爲695億美元,均在12個月內到期。所以,它的負債總額比現金和短期應收賬款高出640億美元。
Of course, CBRE Group has a titanic market capitalization of US$34.7b, so these liabilities are probably manageable. However, we do think it is worth keeping an eye on its balance sheet strength, as it may change over time.
當然,CBRE Group擁有347億美元的巨額市值,所以這些負債可能是可管理的。然而,我們認爲值得密切關注其資產負債表的強弱,因爲它可能會隨着時間而變化。
In order to size up a company's debt relative to its earnings, we calculate its net debt divided by its earnings before interest, tax, depreciation, and amortization (EBITDA) and its earnings before interest and tax (EBIT) divided by its interest expense (its interest cover). The advantage of this approach is that we take into account both the absolute quantum of debt (with net debt to EBITDA) and the actual interest expenses associated with that debt (with its interest cover ratio).
爲了衡量公司相對於其收益的債務情況,我們計算其淨負債除以利息、稅項、折舊和攤銷前收益(EBITDA)和其利息支出除以利息前收益(EBIT)的比例(其利息覆蓋率)。這種方法的優點是,我們既考慮了債務的絕對量(淨負債與 EBITDA),又考慮到了與該債務相關的實際利息支出(其利息覆蓋率)。
CBRE Group's net debt of 2.1 times EBITDA suggests graceful use of debt. And the alluring interest cover (EBIT of 8.1 times interest expense) certainly does not do anything to dispel this impression. It is well worth noting that CBRE Group's EBIT shot up like bamboo after rain, gaining 40% in the last twelve months. That'll make it easier to manage its debt. When analysing debt levels, the balance sheet is the obvious place to start. But ultimately the future profitability of the business will decide if CBRE Group can strengthen its balance sheet over time. So if you're focused on the future you can check out this free report showing analyst profit forecasts.
CBRE Group的淨債務爲EBITDA的2.1倍,表明其巧妙地利用了債務。而令人動心的利息保障倍數(EBIT爲利息支出的8.1倍)肯定不會對這種印象有什麼影響。值得注意的是,CBRE Group的EBIT在過去12個月中增長了40%,如雨後新竹般快速增長。這會使其更容易管理債務。在分析債務水平時,資產負債表是顯而易見的起點。但最終業務的未來盈利能力將決定CBRE Group能否加強其資產負債表。所以如果你關注未來,可以查看這份顯示分析師盈利預測的免費報告。
Finally, a company can only pay off debt with cold hard cash, not accounting profits. So we always check how much of that EBIT is translated into free cash flow. Over the most recent three years, CBRE Group recorded free cash flow worth 77% of its EBIT, which is around normal, given free cash flow excludes interest and tax. This cold hard cash means it can reduce its debt when it wants to.
最後,公司只能用現金而不是會計利潤償還債務。所以我們始終檢查EBIT中有多少被轉化爲自由現金流。在最近三年中,CBRE Group的自由現金流價值相當於其EBIT的77%,這是正常水平,因爲自由現金流不包括利息和稅金。這份冷硬現金意味着它可以在需要時減少債務。
Our View
我們的觀點
The good news is that CBRE Group's demonstrated ability to grow its EBIT delights us like a fluffy puppy does a toddler. And the good news does not stop there, as its conversion of EBIT to free cash flow also supports that impression! Zooming out, CBRE Group seems to use debt quite reasonably; and that gets the nod from us. After all, sensible leverage can boost returns on equity. The balance sheet is clearly the area to focus on when you are analysing debt. However, not all investment risk resides within the balance sheet - far from it. For example CBRE Group has 2 warning signs (and 1 which shouldn't be ignored) we think you should know about.
好消息是世邦魏理仕展現的EBIt增長能力讓我們像小孩對待毛絨玩具狗一樣開心。而且好消息還不止於此,它將EBIt轉化爲自由現金流也支持了這一印象!放大看,世邦魏理仕似乎相當適度地使用債務;這得到了我們的認可。畢竟,合理的槓桿可以提升股東權益回報率。資產負債表顯然是你分析債務時要專注的領域。然而,並非所有投資風險都存在於資產負債表中 - 遠非如此。例如,世邦魏理仕有2個警示信號(還有1個不容忽視的),我們認爲你應該知道。
Of course, if you're the type of investor who prefers buying stocks without the burden of debt, then don't hesitate to discover our exclusive list of net cash growth stocks, today.
當然,如果您是那種喜歡購買沒有債務負擔的股票的投資者,那麼不要猶豫,立即發現我們獨家的淨現金增長股票列表。
Have feedback on this article? Concerned about the content? Get in touch with us directly. Alternatively, email editorial-team (at) simplywallst.com.
This article by Simply Wall St is general in nature. We provide commentary based on historical data and analyst forecasts only using an unbiased methodology and our articles are not intended to be financial advice. It does not constitute a recommendation to buy or sell any stock, and does not take account of your objectives, or your financial situation. We aim to bring you long-term focused analysis driven by fundamental data. Note that our analysis may not factor in the latest price-sensitive company announcements or qualitative material. Simply Wall St has no position in any stocks mentioned.
對本文有任何反饋?對內容有任何疑慮?請直接與我們聯繫。或者,發送電子郵件至editorial-team@simplywallst.com。
這篇文章是Simply Wall St的一般性文章。我們根據歷史數據和分析師預測提供評論,只使用公正的方法論,我們的文章並不意味着提供任何金融建議。文章不構成買賣任何股票的建議,也不考慮您的目標或您的財務狀況。我們的目標是帶給您基本數據驅動的長期關注分析。請注意,我們的分析可能不考慮最新的價格敏感公司公告或定性材料。Simply Wall St沒有任何股票頭寸。
譯文內容由第三人軟體翻譯。