
Inter Parfums, Inc.'s (NASDAQ:IPAR) Fundamentals Look Pretty Strong: Could The Market Be Wrong About The Stock?
Inter Parfums, Inc.'s (NASDAQ:IPAR) Fundamentals Look Pretty Strong: Could The Market Be Wrong About The Stock?
Inter Parfums (NASDAQ:IPAR) has had a rough month with its share price down 10%. But if you pay close attention, you might gather that its strong financials could mean that the stock could potentially see an increase in value in the long-term, given how markets usually reward companies with good financial health. In this article, we decided to focus on Inter Parfums' ROE.
依特香水(納斯達克:IPAR)股價下跌了10%,最近一個月表現不佳。但是如果你仔細觀察,你可能會發現其強勁的財務狀況意味着股票在長期內有可能增值,因爲市場通常會獎勵那些財務狀況良好的公司。在本文中,我們決定關注依特香水的roe。
Return on equity or ROE is an important factor to be considered by a shareholder because it tells them how effectively their capital is being reinvested. In other words, it is a profitability ratio which measures the rate of return on the capital provided by the company's shareholders.
對於股東來說,股東回報率(ROE)是一個重要的考慮因素,因爲它告訴股東他們的資本被有效地再投資了多少。換句話說,它是一個衡量公司股東提供的資本回報率的盈利能力比率。
How Do You Calculate Return On Equity?
怎樣計算ROE?
Return on equity can be calculated by using the formula:
股東權益報酬率可以使用以下公式計算:
Return on Equity = Net Profit (from continuing operations) ÷ Shareholders' Equity
淨資產收益率 = 淨利潤(從持續經營中獲得)÷ 股東權益
So, based on the above formula, the ROE for Inter Parfums is:
因此,根據上述公式,Inter Parfums的ROE爲:
19% = US$174m ÷ US$901m (Based on the trailing twelve months to June 2024).
19% = 1.74億美元 ÷ 9.01億美元(根據截至2024年6月的過去12個月計算)
The 'return' is the income the business earned over the last year. Another way to think of that is that for every $1 worth of equity, the company was able to earn $0.19 in profit.
「回報」是業務在過去一年中賺取的收入。從另一個角度來看,每1美元的淨資產,該公司能夠賺取0.19美元的利潤。
What Is The Relationship Between ROE And Earnings Growth?
ROE與盈利增長之間的關係是什麼?
So far, we've learned that ROE is a measure of a company's profitability. Depending on how much of these profits the company reinvests or "retains", and how effectively it does so, we are then able to assess a company's earnings growth potential. Assuming everything else remains unchanged, the higher the ROE and profit retention, the higher the growth rate of a company compared to companies that don't necessarily bear these characteristics.
到目前爲止,我們已經了解到ROE是衡量公司盈利能力的指標。根據公司重新投資或「保留」的利潤數量及其有效性,我們能夠估計公司盈利增長潛力。假設其他一切保持不變,ROE和利潤保留率越高,相對於不一定擁有這些特徵的公司而言,公司的增長率就越高。
A Side By Side comparison of Inter Parfums' Earnings Growth And 19% ROE
依特香水的盈利增長和19%的roe的對比
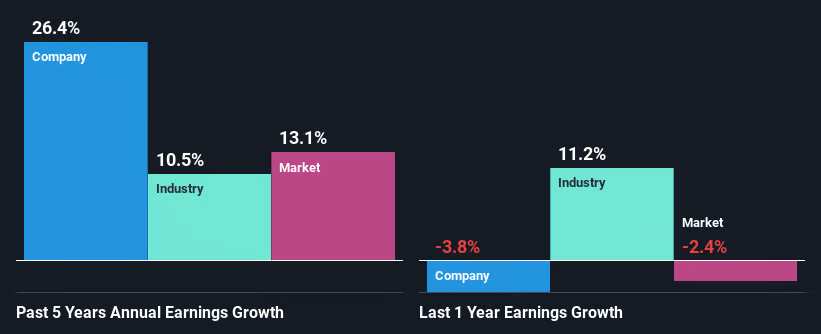
At first glance, Inter Parfums seems to have a decent ROE. Further, the company's ROE compares quite favorably to the industry average of 14%. This probably laid the ground for Inter Parfums' significant 26% net income growth seen over the past five years. However, there could also be other causes behind this growth. For instance, the company has a low payout ratio or is being managed efficiently.
乍一看,依特香水的roe似乎還不錯。此外,該公司的roe與行業平均值14%相比較有利。這可能是導致依特香水在過去五年中實現26%淨利潤增長的基礎。然而,這種增長背後還可能有其它原因。例如公司的低分紅派息率或高效的經營管理。
We then compared Inter Parfums' net income growth with the industry and we're pleased to see that the company's growth figure is higher when compared with the industry which has a growth rate of 10% in the same 5-year period.
然後我們將依特香水的淨利潤增長與行業進行了比較,很高興地看到該公司的增長率要高於同樣5年期間行業的10%。
Earnings growth is an important metric to consider when valuing a stock. It's important for an investor to know whether the market has priced in the company's expected earnings growth (or decline). Doing so will help them establish if the stock's future looks promising or ominous. One good indicator of expected earnings growth is the P/E ratio which determines the price the market is willing to pay for a stock based on its earnings prospects. So, you may want to check if Inter Parfums is trading on a high P/E or a low P/E, relative to its industry.
盈利增長是評估股票價值時要考慮的重要指標。投資者需要了解市場是否已經將公司預期的盈利增長(或下降)價格化。 這樣做將幫助他們確定股票的未來看起來是充滿希望還是不祥。 預期盈利增長的一個良好指標是市盈率,它根據公司的盈利前景確定市場願意爲一隻股票支付的價格。因此,您可能希望檢查依特香水的市盈率是偏高還是偏低,相對於其所在的行業板塊。
Is Inter Parfums Making Efficient Use Of Its Profits?
依特香水是否有效利用其利潤?
The three-year median payout ratio for Inter Parfums is 49%, which is moderately low. The company is retaining the remaining 51%. So it seems that Inter Parfums is reinvesting efficiently in a way that it sees impressive growth in its earnings (discussed above) and pays a dividend that's well covered.
依特香水的三年中位數股利支付比率爲49%,屬於中等偏低水平。 公司留下了剩餘的51%。因此,依特香水好像在有效地再投資,以實現盈利的顯著增長(如前文所述),並支付得到充分覆蓋的股息。
Besides, Inter Parfums has been paying dividends for at least ten years or more. This shows that the company is committed to sharing profits with its shareholders.
此外,依特香水至少連續十年支付股息。這顯示公司致力於與股東分享利潤。
Conclusion
結論
In total, we are pretty happy with Inter Parfums' performance. Specifically, we like that the company is reinvesting a huge chunk of its profits at a high rate of return. This of course has caused the company to see substantial growth in its earnings. With that said, the latest industry analyst forecasts reveal that the company's earnings growth is expected to slow down. To know more about the company's future earnings growth forecasts take a look at this free report on analyst forecasts for the company to find out more.
總體而言,我們對依特香水的表現非常滿意。具體而言,我們喜歡公司以高回報率對其利潤進行大規模再投資。這當然導致了公司利潤的大幅增長。然而,最新的行業分析師預測顯示,公司的利潤增長預計將放緩。要了解有關公司未來利潤增長預測的更多信息,請參閱此免費分析師預測報告。
Have feedback on this article? Concerned about the content? Get in touch with us directly. Alternatively, email editorial-team (at) simplywallst.com.
This article by Simply Wall St is general in nature. We provide commentary based on historical data and analyst forecasts only using an unbiased methodology and our articles are not intended to be financial advice. It does not constitute a recommendation to buy or sell any stock, and does not take account of your objectives, or your financial situation. We aim to bring you long-term focused analysis driven by fundamental data. Note that our analysis may not factor in the latest price-sensitive company announcements or qualitative material. Simply Wall St has no position in any stocks mentioned.
對本文有任何反饋?對內容有任何疑慮?請直接與我們聯繫。或者,發送電子郵件至editorial-team@simplywallst.com。
這篇文章是Simply Wall St的一般性文章。我們根據歷史數據和分析師預測提供評論,只使用公正的方法論,我們的文章並不意味着提供任何金融建議。文章不構成買賣任何股票的建議,也不考慮您的目標或您的財務狀況。我們的目標是帶給您基本數據驅動的長期關注分析。請注意,我們的分析可能不考慮最新的價格敏感公司公告或定性材料。Simply Wall St沒有任何股票頭寸。
譯文內容由第三人軟體翻譯。