
Is Vulcan Materials (NYSE:VMC) Using Too Much Debt?
Is Vulcan Materials (NYSE:VMC) Using Too Much Debt?
 Zooming in on the latest balance sheet data, we can see that Vulcan Materials had liabilities of US$796.8m due within 12 months and liabilities of US$5.69b due beyond that. On the other hand, it had cash of US$111.0m and US$1.06b worth of receivables due within a year. So it has liabilities totalling US$5.31b more than its cash and near-term receivables, combined.
 David Iben put it well when he said, 'Volatility is not a risk we care about. What we care about is avoiding the permanent loss of capital.' So it seems the smart money knows that debt - which is usually involved in bankruptcies - is a very important factor, when you assess how risky a company is. As with many other companies Vulcan Materials Company (NYSE:VMC) makes use of debt. But the more important question is: how much risk is that debt creating?
大衛·艾本說得很好,'波動性不是我們關心的風險。我們關心的是避免永久性的資本損失。'因此,聰明的人知道,債務是通常與破產有關的很重要的因素,當您評估一家公司的風險時。正如其他許多公司一樣,火神材料公司(紐交所: VMC)也利用債務。但更重要的問題是:這種債務帶來了多大的風險?
When Is Debt Dangerous?
債務何時有危險?
Debt assists a business until the business has trouble paying it off, either with new capital or with free cash flow. Ultimately, if the company can't fulfill its legal obligations to repay debt, shareholders could walk away with nothing. However, a more usual (but still expensive) situation is where a company must dilute shareholders at a cheap share price simply to get debt under control. Having said that, the most common situation is where a company manages its debt reasonably well - and to its own advantage. The first thing to do when considering how much debt a business uses is to look at its cash and debt together.
債務可以幫助企業,直到企業無法獲得新資本或自由現金流來還債。如果公司無法履行償還債務的法律義務,股東可能無法獲得任何回報。然而,更常見的情況是,公司必須以廉價股價稀釋股權以控制債務,儘管這依然代價高昂。話雖如此,最常見的情況是,企業合理管理債務以符合自身利益。在考慮企業使用多少債務時,首先要做的是查看現金和債務的總和。
How Much Debt Does Vulcan Materials Carry?
火神材料承載了多少債務?
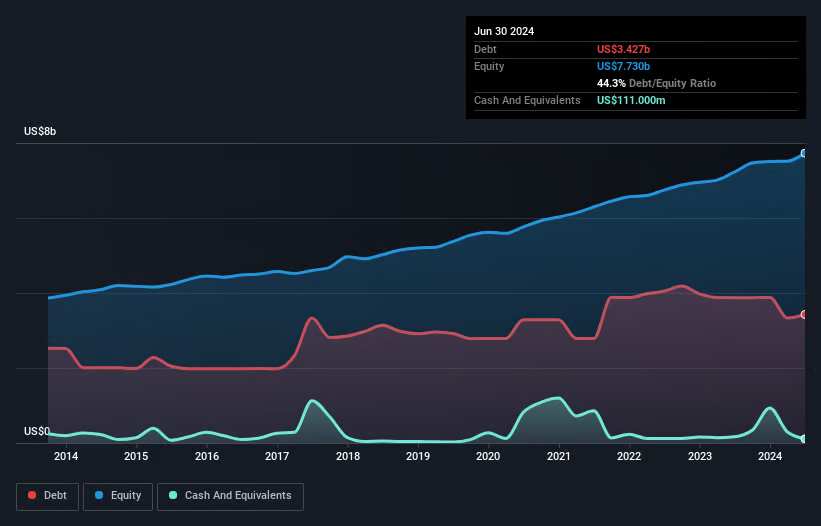
The image below, which you can click on for greater detail, shows that Vulcan Materials had debt of US$3.43b at the end of June 2024, a reduction from US$3.87b over a year. On the flip side, it has US$111.0m in cash leading to net debt of about US$3.32b.
您可以點擊下面的圖像以獲取更多細節,圖像顯示火神材料在2024年6月底的債務爲34.3億美元,較去年的38.7億美元有所減少。而另一方面,火神材料擁有1.11億美元的現金,從而形成淨債務約爲33.2億美元。
How Healthy Is Vulcan Materials' Balance Sheet?
火神材料的資產負債表健康情況如何?
Zooming in on the latest balance sheet data, we can see that Vulcan Materials had liabilities of US$796.8m due within 12 months and liabilities of US$5.69b due beyond that. On the other hand, it had cash of US$111.0m and US$1.06b worth of receivables due within a year. So it has liabilities totalling US$5.31b more than its cash and near-term receivables, combined.
深入分析最新的資產負債表數據,我們可以看到火神材料在12個月內應付的負債爲796.8億美元,在此之外的負債爲569億美元。另一方面,其現金爲1.11億美元,並且有10.6億美元的應收賬款在一年內到期。因此,其負債總額超過現金和短期應收賬款總和53.1億美元。
Since publicly traded Vulcan Materials shares are worth a very impressive total of US$31.7b, it seems unlikely that this level of liabilities would be a major threat. Having said that, it's clear that we should continue to monitor its balance sheet, lest it change for the worse.
鑑於公開交易的火神材料股票總值達到317億美元,這個負債水平似乎不太可能構成重大威脅。但是,我們明顯應繼續關注其資產負債表,以防情況惡化。
We measure a company's debt load relative to its earnings power by looking at its net debt divided by its earnings before interest, tax, depreciation, and amortization (EBITDA) and by calculating how easily its earnings before interest and tax (EBIT) cover its interest expense (interest cover). This way, we consider both the absolute quantum of the debt, as well as the interest rates paid on it.
我們通過將公司的淨債務與其息稅折舊攤銷前利潤(EBITDA)相除,並計算其息稅前利潤(EBIT)如何覆蓋其利息費用(利息覆蓋率)來衡量公司的債務負擔相對於其盈利能力。因此,我們同時考慮債務的絕對數量以及所支付的利率。
With a debt to EBITDA ratio of 1.7, Vulcan Materials uses debt artfully but responsibly. And the fact that its trailing twelve months of EBIT was 8.5 times its interest expenses harmonizes with that theme. And we also note warmly that Vulcan Materials grew its EBIT by 17% last year, making its debt load easier to handle. The balance sheet is clearly the area to focus on when you are analysing debt. But ultimately the future profitability of the business will decide if Vulcan Materials can strengthen its balance sheet over time. So if you're focused on the future you can check out this free report showing analyst profit forecasts.
火神材料的債務與息稅折舊攤銷前利潤(EBITDA)比率爲1.7,合理而謹慎地利用債務。事實上,其近12個月的EBIT是其利息費用的8.5倍,與這一主題相協調。我們還熱切地注意到,火神材料去年的EBIT增長了17%,這使得其債務負擔更容易處理。資產負債表顯然是分析債務時需要重點關注的領域。但最終,企業未來的盈利能力將決定火神材料能否隨時間加強其資產負債表。因此,如果您關注未來,可以查看此份免費報告,了解分析師的利潤預測。
But our final consideration is also important, because a company cannot pay debt with paper profits; it needs cold hard cash. So we clearly need to look at whether that EBIT is leading to corresponding free cash flow. Looking at the most recent three years, Vulcan Materials recorded free cash flow of 45% of its EBIT, which is weaker than we'd expect. That's not great, when it comes to paying down debt.
但是我們最後要考慮的也很重要,因爲公司無法用紙面利潤償還債務,而是需要現金。因此,我們需要清楚地看是否EBIT能夠帶來對應的自由現金流。通過查看最近三年的數據,我們發現火神材料的自由現金流佔其EBIT的45%,低於我們的預期。就償還債務而言,這並不好。
Our View
我們的觀點
The good news is that Vulcan Materials's demonstrated ability to grow its EBIT delights us like a fluffy puppy does a toddler. And we also thought its interest cover was a positive. All these things considered, it appears that Vulcan Materials can comfortably handle its current debt levels. Of course, while this leverage can enhance returns on equity, it does bring more risk, so it's worth keeping an eye on this one. When analysing debt levels, the balance sheet is the obvious place to start. However, not all investment risk resides within the balance sheet - far from it. To that end, you should be aware of the 2 warning signs we've spotted with Vulcan Materials .
好消息是,火神材料展現出增長EBIt的能力,就像一隻毛茸茸的小狗讓人愉悅一樣。而且我們也認爲它的利息覆蓋率是個正面的因素。考慮到所有這些因素,火神材料似乎可以輕鬆地處理其當前的債務水平。當然,雖然這種槓桿可以提高股本回報率,但它也帶來更多風險,因此值得密切關注。在分析債務水平時,資產負債表是顯而易見的起點。然而,並非所有投資風險都存在於資產負債表中,遠非如此。因此,您應該注意我們發現的火神材料的2個警示信號。
Of course, if you're the type of investor who prefers buying stocks without the burden of debt, then don't hesitate to discover our exclusive list of net cash growth stocks, today.
當然,如果您是那種喜歡購買沒有債務負擔的股票的投資者,那麼不要猶豫,立即發現我們獨家的淨現金增長股票列表。
Have feedback on this article? Concerned about the content? Get in touch with us directly. Alternatively, email editorial-team (at) simplywallst.com.
This article by Simply Wall St is general in nature. We provide commentary based on historical data and analyst forecasts only using an unbiased methodology and our articles are not intended to be financial advice. It does not constitute a recommendation to buy or sell any stock, and does not take account of your objectives, or your financial situation. We aim to bring you long-term focused analysis driven by fundamental data. Note that our analysis may not factor in the latest price-sensitive company announcements or qualitative material. Simply Wall St has no position in any stocks mentioned.
對本文有任何反饋?對內容有任何疑慮?請直接與我們聯繫。或者,發送電子郵件至editorial-team@simplywallst.com。
這篇文章是Simply Wall St的一般性文章。我們根據歷史數據和分析師預測提供評論,只使用公正的方法論,我們的文章並不意味着提供任何金融建議。文章不構成買賣任何股票的建議,也不考慮您的目標或您的財務狀況。我們的目標是帶給您基本數據驅動的長期關注分析。請注意,我們的分析可能不考慮最新的價格敏感公司公告或定性材料。Simply Wall St沒有任何股票頭寸。
譯文內容由第三人軟體翻譯。
