
The 21% Return This Week Takes Y-mAbs Therapeutics' (NASDAQ:YMAB) Shareholders One-year Gains to 178%
The 21% Return This Week Takes Y-mAbs Therapeutics' (NASDAQ:YMAB) Shareholders One-year Gains to 178%
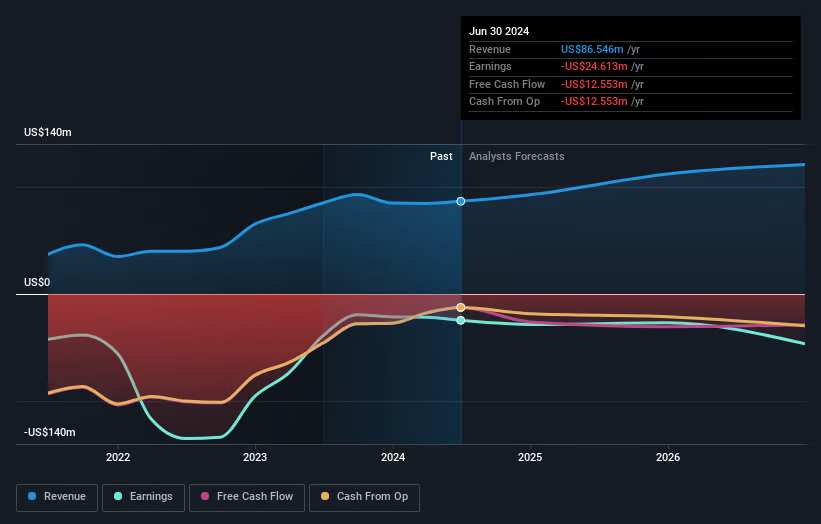
 Over the last twelve months, Y-mAbs Therapeutics' revenue grew by 1.8%. That's not great considering the company is losing money. So we wouldn't have expected the share price to rise by 178%. We're happy that investors have made money, though we wonder if the increase will be sustained. It's quite likely that the market is considering other factors, not just revenue growth.
 Unless you borrow money to invest, the potential losses are limited. But if you pick the right stock, you can make a lot more than 100%. For example, the Y-mAbs Therapeutics, Inc. (NASDAQ:YMAB) share price had more than doubled in just one year - up 178%. On top of that, the share price is up 25% in about a quarter. This could be related to the recent financial results, released recently - you can catch up on the most recent data by reading our company report. Zooming out, the stock is actually down 49% in the last three years.
除非你借錢投資,否則潛在損失是有限的。但如果你選對了股票,賺得的利潤可能超過100%。舉個例子,Y-mAbs Therapeutics, Inc. (納斯達克: YMAB) 的股價在短短一年內翻倍——上漲了178%。除此之外,股價在一個季度內上漲了25%。這可能與最近披露的財務業績有關——你可以通過閱讀我們的公司報告了解最新的數據。放大視角來看,這支股票在過去三年中實際上下跌了49%。
On the back of a solid 7-day performance, let's check what role the company's fundamentals have played in driving long term shareholder returns.
在穩定的七天表現之後,讓我們看看公司的基本面對長期股東回報的影響。
Because Y-mAbs Therapeutics made a loss in the last twelve months, we think the market is probably more focussed on revenue and revenue growth, at least for now. Shareholders of unprofitable companies usually desire strong revenue growth. That's because fast revenue growth can be easily extrapolated to forecast profits, often of considerable size.
由於Y-mAbs Therapeutics在過去十二個月中虧損了,我們認爲目前市場可能更關注營業收入和營業收入增長。沒有盈利公司的股東通常希望營業收入增長強勁。這是因爲快速的營業收入增長可以輕易地推測出相當大的利潤。
Over the last twelve months, Y-mAbs Therapeutics' revenue grew by 1.8%. That's not great considering the company is losing money. So we wouldn't have expected the share price to rise by 178%. We're happy that investors have made money, though we wonder if the increase will be sustained. It's quite likely that the market is considering other factors, not just revenue growth.
在過去的十二個月內,Y-mAbs Therapeutics的營業收入增長了1.8%。考慮到該公司的虧損情況,這並不好。所以我們不會預期股價會上漲178%。儘管如此,我們很高興投資者賺了錢,但我們想知道這種增長是否會持續。市場很可能考慮的不僅僅是營業收入增長。
The graphic below depicts how earnings and revenue have changed over time (unveil the exact values by clicking on the image).
下面的圖表顯示了收益和營收隨時間的變化情況(通過單擊圖像揭示確切的值)。
You can see how its balance sheet has strengthened (or weakened) over time in this free interactive graphic.
你可以在這個免費的互動圖表中看到它的資產負債表如何隨着時間的推移而加強(或削弱)。
A Different Perspective
不同的觀點
It's good to see that Y-mAbs Therapeutics has rewarded shareholders with a total shareholder return of 178% in the last twelve months. There's no doubt those recent returns are much better than the TSR loss of 7% per year over five years. The long term loss makes us cautious, but the short term TSR gain certainly hints at a brighter future. I find it very interesting to look at share price over the long term as a proxy for business performance. But to truly gain insight, we need to consider other information, too. Like risks, for instance. Every company has them, and we've spotted 4 warning signs for Y-mAbs Therapeutics (of which 1 is a bit concerning!) you should know about.
很高興看到y-mabs therapeutics在過去十二個月裏以總股東回報率達到了178%的獎勵股東。毫無疑問,最近的回報要比過去五年平均每年7%的股東回報率損失要好得多。長期的損失使我們感到謹慎,但短期的股東回報率增長確實暗示着更加光明的未來。我發現長期來看股價作爲業務績效的一種替代很有趣。但要真正獲得見解,我們需要考慮其他信息。比如風險。每家公司都會面臨風險,我們已經發現了y-mabs therapeutics的4個警告信號(其中1個有點令人擔憂!)你應該知道。
We will like Y-mAbs Therapeutics better if we see some big insider buys. While we wait, check out this free list of undervalued stocks (mostly small caps) with considerable, recent, insider buying.
如果我們看到一些內部人士的大規模買入,我們會更喜歡y-mabs therapeutics。在等待的時候,可以查看一下這份免費的被低估股票名單(主要是小市值股票),其中包括相當多最近有內部人員買入的股票。
Please note, the market returns quoted in this article reflect the market weighted average returns of stocks that currently trade on American exchanges.
請注意,本文所引述的市場回報反映了目前在美國交易所上市的股票的市場加權平均回報。
Have feedback on this article? Concerned about the content? Get in touch with us directly. Alternatively, email editorial-team (at) simplywallst.com.
This article by Simply Wall St is general in nature. We provide commentary based on historical data and analyst forecasts only using an unbiased methodology and our articles are not intended to be financial advice. It does not constitute a recommendation to buy or sell any stock, and does not take account of your objectives, or your financial situation. We aim to bring you long-term focused analysis driven by fundamental data. Note that our analysis may not factor in the latest price-sensitive company announcements or qualitative material. Simply Wall St has no position in any stocks mentioned.
對本文有任何反饋?對內容有任何疑慮?請直接與我們聯繫。或者,發送電子郵件至editorial-team@simplywallst.com。
這篇文章是Simply Wall St的一般性文章。我們根據歷史數據和分析師預測提供評論,只使用公正的方法論,我們的文章並不意味着提供任何金融建議。文章不構成買賣任何股票的建議,也不考慮您的目標或您的財務狀況。我們的目標是帶給您基本數據驅動的長期關注分析。請注意,我們的分析可能不考慮最新的價格敏感公司公告或定性材料。Simply Wall St沒有任何股票頭寸。
譯文內容由第三人軟體翻譯。