
IQVIA Holdings' (NYSE:IQV) Five-year Earnings Growth Trails the Favorable Shareholder Returns
IQVIA Holdings' (NYSE:IQV) Five-year Earnings Growth Trails the Favorable Shareholder Returns
If you buy and hold a stock for many years, you'd hope to be making a profit. But more than that, you probably want to see it rise more than the market average. Unfortunately for shareholders, while the IQVIA Holdings Inc. (NYSE:IQV) share price is up 60% in the last five years, that's less than the market return. Looking at the last year alone, the stock is up 14%.
如果你購買並持有股票多年,你希望能獲得盈利。但更重要的是,你可能希望看到它的漲幅超過市場平均水平。不幸的是,對於股東們來說,雖然IQVIA Holdings Inc.(NYSE:IQV)股價在過去五年中上漲了60%,但這低於市場回報率。僅看過去一年,該股漲幅爲14%。
Since it's been a strong week for IQVIA Holdings shareholders, let's have a look at trend of the longer term fundamentals.
因爲對於艾昆緯股東來說,上週表現強勁,讓我們來看一下更長期的基本面趨勢。
In his essay The Superinvestors of Graham-and-Doddsville Warren Buffett described how share prices do not always rationally reflect the value of a business. One flawed but reasonable way to assess how sentiment around a company has changed is to compare the earnings per share (EPS) with the share price.
在他的文章《格雷厄姆-多德斯維爾的超級投資人》中,禾倫·巴菲特描述了股票價格並不總是理性地反映公司價值的情況。一種有缺陷但合理的評估公司情緒如何變化的方法是將每股收益(EPS)與股票價格進行比較。
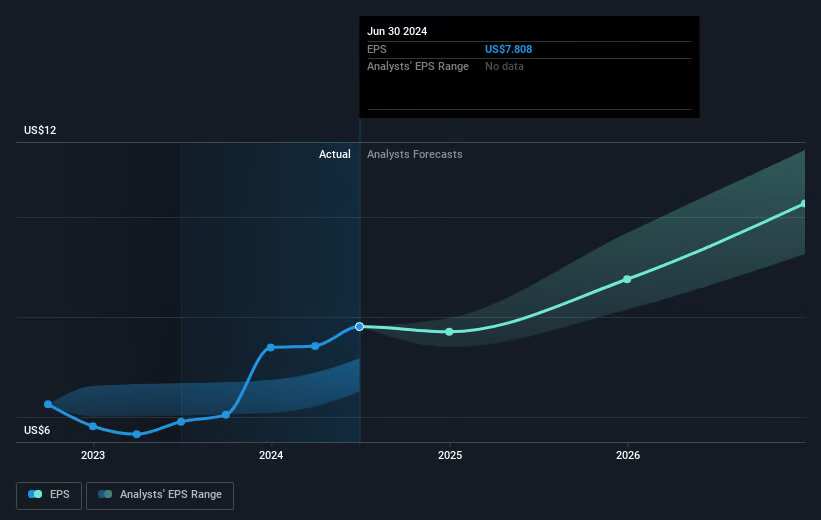
During five years of share price growth, IQVIA Holdings achieved compound earnings per share (EPS) growth of 44% per year. The EPS growth is more impressive than the yearly share price gain of 10% over the same period. So one could conclude that the broader market has become more cautious towards the stock.
在股價增長的五年期間,艾昆緯公司實現了每年44%的複合每股收益(EPS)增長。與同期每年10%的股價漲幅相比,EPS的增長更爲引人注目。因此,可以得出結論,整體市場對該股變得更加謹慎。
You can see below how EPS has changed over time (discover the exact values by clicking on the image).
下面可以看到每股收益隨時間的變化情況(通過點擊圖像來查看確切數值)。
We know that IQVIA Holdings has improved its bottom line over the last three years, but what does the future have in store? You can see how its balance sheet has strengthened (or weakened) over time in this free interactive graphic.
我們知道IQVIA Holdings在過去三年中改善了其底線,但未來會如何呢?您可以在這個免費的互動圖表中看到它的資產負債表在時間上是如何變強(或變弱)的。
A Different Perspective
不同的觀點
IQVIA Holdings provided a TSR of 14% over the last twelve months. But that return falls short of the market. On the bright side, that's still a gain, and it's actually better than the average return of 10% over half a decade This suggests the company might be improving over time. While it is well worth considering the different impacts that market conditions can have on the share price, there are other factors that are even more important. For instance, we've identified 1 warning sign for IQVIA Holdings that you should be aware of.
在過去十二個月中,IQVIA Holdings的總收益率爲14%。但這個回報還不如市場。好的一面是,這仍然是一筆盈利,而且實際上好於過去五年10%的平均回報。這表明公司可能在不斷改善。雖然考慮到市場狀況對股價的影響是非常值得的,但還有其他更重要的因素。例如,我們已經發現了IQVIA Holdings的1個警示信號,您應該了解。
If you like to buy stocks alongside management, then you might just love this free list of companies. (Hint: many of them are unnoticed AND have attractive valuation).
如果您喜歡與管理層一起購買股票,那麼您可能會喜歡這個公司的免費列表。 (提示:其中許多公司不爲人注意且具有吸引力的估值。)
Please note, the market returns quoted in this article reflect the market weighted average returns of stocks that currently trade on American exchanges.
請注意,本文所引述的市場回報反映了目前在美國交易所上市的股票的市場加權平均回報。
Have feedback on this article? Concerned about the content? Get in touch with us directly. Alternatively, email editorial-team (at) simplywallst.com.
This article by Simply Wall St is general in nature. We provide commentary based on historical data and analyst forecasts only using an unbiased methodology and our articles are not intended to be financial advice. It does not constitute a recommendation to buy or sell any stock, and does not take account of your objectives, or your financial situation. We aim to bring you long-term focused analysis driven by fundamental data. Note that our analysis may not factor in the latest price-sensitive company announcements or qualitative material. Simply Wall St has no position in any stocks mentioned.
對本文有任何反饋?對內容有任何疑慮?請直接與我們聯繫。或者,發送電子郵件至editorial-team@simplywallst.com。
這篇文章是Simply Wall St的一般性文章。我們根據歷史數據和分析師預測提供評論,只使用公正的方法論,我們的文章並不意味着提供任何金融建議。文章不構成買賣任何股票的建議,也不考慮您的目標或您的財務狀況。我們的目標是帶給您基本數據驅動的長期關注分析。請注意,我們的分析可能不考慮最新的價格敏感公司公告或定性材料。Simply Wall St沒有任何股票頭寸。
譯文內容由第三人軟體翻譯。