
An Intrinsic Calculation For Fluence Energy, Inc. (NASDAQ:FLNC) Suggests It's 45% Undervalued
An Intrinsic Calculation For Fluence Energy, Inc. (NASDAQ:FLNC) Suggests It's 45% Undervalued
Key Insights
主要見解
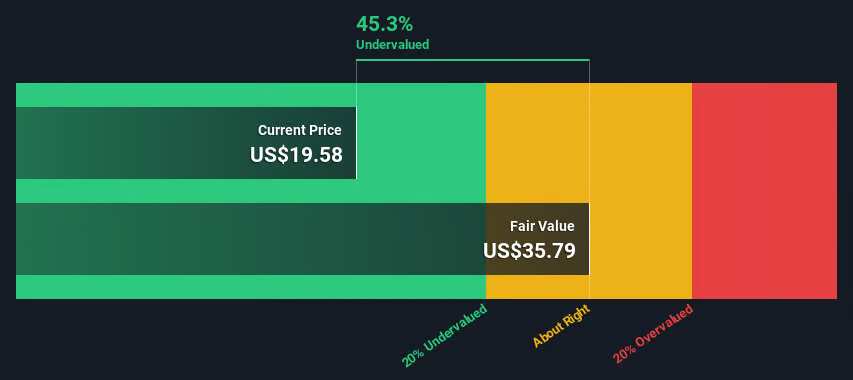
- The projected fair value for Fluence Energy is US$35.79 based on 2 Stage Free Cash Flow to Equity
- Current share price of US$19.58 suggests Fluence Energy is potentially 45% undervalued
- The US$27.42 analyst price target for FLNC is 23% less than our estimate of fair value
- 基於2階段自由現金流對股東權益的預測公允價值爲Fluence Energy的35.79美元。
- 當前股價19.58美元表明Fluence Energy有可能被低估了45%。
- FLNC的分析師目標價爲27.42美元,比我們對公允價值的估計低23%。
How far off is Fluence Energy, Inc. (NASDAQ:FLNC) from its intrinsic value? Using the most recent financial data, we'll take a look at whether the stock is fairly priced by estimating the company's future cash flows and discounting them to their present value. We will take advantage of the Discounted Cash Flow (DCF) model for this purpose. Believe it or not, it's not too difficult to follow, as you'll see from our example!
Fluence Energy, Inc. (NASDAQ:FLNC)與其內在價值相差多遠?利用最近的財務數據,我們將通過估計公司未來現金流並將其貼現至現值的方式來判斷股票是否定價合理。我們將利用貼現現金流量(DCF)模型來實現這一目標。信不信由你,從我們的例子中你會發現,這並不太難理解!
We generally believe that a company's value is the present value of all of the cash it will generate in the future. However, a DCF is just one valuation metric among many, and it is not without flaws. Anyone interested in learning a bit more about intrinsic value should have a read of the Simply Wall St analysis model.
我們通常認爲公司的價值是其未來所有現金流的現值。然而,DCF只是衆多估值指標之一,並不是沒有缺陷的。任何有興趣了解內在價值更多信息的人都可以閱讀Simply Wall St的分析模型。
The Model
模型
We are going to use a two-stage DCF model, which, as the name states, takes into account two stages of growth. The first stage is generally a higher growth period which levels off heading towards the terminal value, captured in the second 'steady growth' period. To start off with, we need to estimate the next ten years of cash flows. Where possible we use analyst estimates, but when these aren't available we extrapolate the previous free cash flow (FCF) from the last estimate or reported value. We assume companies with shrinking free cash flow will slow their rate of shrinkage, and that companies with growing free cash flow will see their growth rate slow, over this period. We do this to reflect that growth tends to slow more in the early years than it does in later years.
我們將使用兩階段DCF模型,正如其名稱所述,考慮了兩個增長階段。第一階段通常是一個更高的增長期,之後在第二個穩定增長期中被捕獲到終端價值。首先,我們需要估計未來十年的現金流。我們在可能的情況下使用分析師的估計,但當這些估計不可用時,我們會推斷出上一個自由現金流(FCF)的上一個估計值或報告的價值。我們假設具有萎縮自由現金流的公司將減緩其萎縮速度,而具有增長自由現金流的公司將在這段時間內看到其增長率減緩。我們這樣做是爲了反映早期增長的減速比後期減速更快。
A DCF is all about the idea that a dollar in the future is less valuable than a dollar today, and so the sum of these future cash flows is then discounted to today's value:
DCF的核心概念是未來的每一美元都比現在的每一美元更不值錢,因此我們將這些未來的現金流貼現到當今的價值:
10-year free cash flow (FCF) forecast
10年自由現金流(FCF)預測
| 2025 | 2026 | 2027 | 2028 | 2029 | 2030 | 2031 | 2032 | 2033 | 2034 | |
| Levered FCF ($, Millions) | US$99.3m | US$138.8m | US$193.0m | US$242.0m | US$278.8m | US$310.7m | US$337.8m | US$361.0m | US$381.0m | US$398.7m |
| Growth Rate Estimate Source | Analyst x10 | Analyst x6 | Analyst x1 | Analyst x1 | Est @ 15.23% | Est @ 11.41% | Est @ 8.74% | Est @ 6.87% | Est @ 5.56% | Est @ 4.64% |
| Present Value ($, Millions) Discounted @ 7.0% | US$92.8 | US$121 | US$158 | US$185 | US$199 | US$207 | US$211 | US$211 | US$208 | US$203 |
| 2025 | 2026 | 2027 | 2028 | 2029 | 2030 | 2031 | 2032 | 2033 | 2034 | |
| 槓桿自由現金流 ($, 百萬) | 美元99.3百萬 | Est @ 8.74% | 1.93億美元 | 1724508872487 | Important Assumptions | 儘管重要,貼現現金流計算只是評估公司時需要考慮的衆多因素之一。貼現現金流模型並非完美的股票估值工具。最好是應用不同的情況和假設,看看它們對公司估值的影響。例如,公司的權益成本或無風險利率的變化可能會顯著影響估值。我們能否找出公司爲什麼以折價交易的原因?對於Fluence Energy,我們總結了三個您應該進一步研究的關鍵方面: | 3.81億美元 | PS. Simply Wall St updates its DCF calculation for every American stock every day, so if you want to find the intrinsic value of any other stock just search here. | ||
| 增長率估計來源 | 分析師共有10位 | 分析師x6 | 分析師x1 | 分析師x1 | 以11.41%的速度預估。 | 以8.74%的估值 | 估計 @ 6.87% | 估計爲5.56% | 以4.64%爲基礎的估值 | |
| 按7.0%折現的現值(百萬美元) | 92.8美元 | 121美元 | 美元158 | 185 | 美元199 | 207美元 | 211美元。 | 211美元。 | 208美元 | 美元203 |
("Est" = FCF growth rate estimated by Simply Wall St)
Present Value of 10-year Cash Flow (PVCF) = US$1.8b
("Est" = Simply Wall St 估計的自由現金流增長率)
未來10年現金流的現值(PVCF)=美元18億
After calculating the present value of future cash flows in the initial 10-year period, we need to calculate the Terminal Value, which accounts for all future cash flows beyond the first stage. The Gordon Growth formula is used to calculate Terminal Value at a future annual growth rate equal to the 5-year average of the 10-year government bond yield of 2.5%. We discount the terminal cash flows to today's value at a cost of equity of 7.0%.
在計算初始10年期現金流的現值之後,我們還需要計算終端價值,該價值考慮了第一階段之後的所有未來現金流。 使用Gordon增長公式計算終端價值,該公式的未來年增長率相等於10年期政府債券收益率的5年平均值2.5%。我們以7.0%的權益成本貼現終期現金流。
Terminal Value (TV)= FCF2034 × (1 + g) ÷ (r – g) = US$399m× (1 + 2.5%) ÷ (7.0%– 2.5%) = US$9.1b
Present Value of Terminal Value (PVTV)= TV / (1 + r)10= US$9.1b÷ ( 1 + 7.0%)10= US$4.7b
The total value, or equity value, is then the sum of the present value of the future cash flows, which in this case is US$6.5b. The last step is to then divide the equity value by the number of shares outstanding. Compared to the current share price of US$19.6, the company appears quite good value at a 45% discount to where the stock price trades currently. Valuations are imprecise instruments though, rather like a telescope - move a few degrees and end up in a different galaxy. Do keep this in mind.
Important Assumptions
重要假設
Now the most important inputs to a discounted cash flow are the discount rate, and of course, the actual cash flows. If you don't agree with these result, have a go at the calculation yourself and play with the assumptions. The DCF also does not consider the possible cyclicality of an industry, or a company's future capital requirements, so it does not give a full picture of a company's potential performance. Given that we are looking at Fluence Energy as potential shareholders, the cost of equity is used as the discount rate, rather than the cost of capital (or weighted average cost of capital, WACC) which accounts for debt. In this calculation we've used 7.0%, which is based on a levered beta of 1.084. Beta is a measure of a stock's volatility, compared to the market as a whole. We get our beta from the industry average beta of globally comparable companies, with an imposed limit between 0.8 and 2.0, which is a reasonable range for a stable business.
Next Steps:
下一步:
Whilst important, the DCF calculation is only one of many factors that you need to assess for a company. The DCF model is not a perfect stock valuation tool. Preferably you'd apply different cases and assumptions and see how they would impact the company's valuation. For example, changes in the company's cost of equity or the risk free rate can significantly impact the valuation. Can we work out why the company is trading at a discount to intrinsic value? For Fluence Energy, we've compiled three pertinent aspects you should further research:
- Risks: For instance, we've identified 1 warning sign for Fluence Energy that you should be aware of.
- Management:Have insiders been ramping up their shares to take advantage of the market's sentiment for FLNC's future outlook? Check out our management and board analysis with insights on CEO compensation and governance factors.
- Other Solid Businesses: Low debt, high returns on equity and good past performance are fundamental to a strong business. Why not explore our interactive list of stocks with solid business fundamentals to see if there are other companies you may not have considered!
- 其他優秀企業:低負債,高股本回報率和良好的過去業績是構建強大企業基礎的基礎。爲什麼不探索我們交互式的股票列表,其中包括具有堅實業務基礎的其他公司?
PS. Simply Wall St updates its DCF calculation for every American stock every day, so if you want to find the intrinsic value of any other stock just search here.
PS. Simply Wall St每天都會更新其對每隻美國股票的折現現金流計算,因此,如果你想找到其他股票的內在價值,只需在此搜索即可。
Have feedback on this article? Concerned about the content? Get in touch with us directly. Alternatively, email editorial-team (at) simplywallst.com.
This article by Simply Wall St is general in nature. We provide commentary based on historical data and analyst forecasts only using an unbiased methodology and our articles are not intended to be financial advice. It does not constitute a recommendation to buy or sell any stock, and does not take account of your objectives, or your financial situation. We aim to bring you long-term focused analysis driven by fundamental data. Note that our analysis may not factor in the latest price-sensitive company announcements or qualitative material. Simply Wall St has no position in any stocks mentioned.
對本文有任何反饋?對內容有任何疑慮?請直接與我們聯繫。或者,發送電子郵件至editorial-team@simplywallst.com。
這篇文章是Simply Wall St的一般性文章。我們根據歷史數據和分析師預測提供評論,只使用公正的方法論,我們的文章並不意味着提供任何金融建議。文章不構成買賣任何股票的建議,也不考慮您的目標或您的財務狀況。我們的目標是帶給您基本數據驅動的長期關注分析。請注意,我們的分析可能不考慮最新的價格敏感公司公告或定性材料。Simply Wall St沒有任何股票頭寸。
譯文內容由第三人軟體翻譯。