
Even Though TAL Education Group (NYSE:TAL) Has Lost US$230m Market Cap in Last 7 Days, Shareholders Are Still up 80% Over 3 Years
Even Though TAL Education Group (NYSE:TAL) Has Lost US$230m Market Cap in Last 7 Days, Shareholders Are Still up 80% Over 3 Years
TAL Education Group (NYSE:TAL) shareholders might be concerned after seeing the share price drop 24% in the last quarter. But that shouldn't obscure the pleasing returns achieved by shareholders over the last three years. In fact, the company's share price bested the return of its market index in that time, posting a gain of 80%.
好未來集團(NYSE:TAL)的股東們可能會對上季度股價下跌24%感到擔憂。但這並不應掩蓋股東們在過去三年中取得的令人滿意的回報。事實上,該公司的股價在此期間超過了市場指數的回報,增長了80%。
In light of the stock dropping 4.2% in the past week, we want to investigate the longer term story, and see if fundamentals have been the driver of the company's positive three-year return.
鑑於該股在過去一週下跌了4.2%,我們想探究更長期的情況,看看基本面是否是公司三年回報的推動力。
In his essay The Superinvestors of Graham-and-Doddsville Warren Buffett described how share prices do not always rationally reflect the value of a business. One way to examine how market sentiment has changed over time is to look at the interaction between a company's share price and its earnings per share (EPS).
在他的《格雷厄姆和道德斯維爾的超級投資者》一文中,禾倫·巴菲特描述了股價並不總是合理反映企業價值的方法。檢驗市場情緒如何隨時間變化的一種方法是觀察公司股價和每股收益(EPS)之間的互動關係。
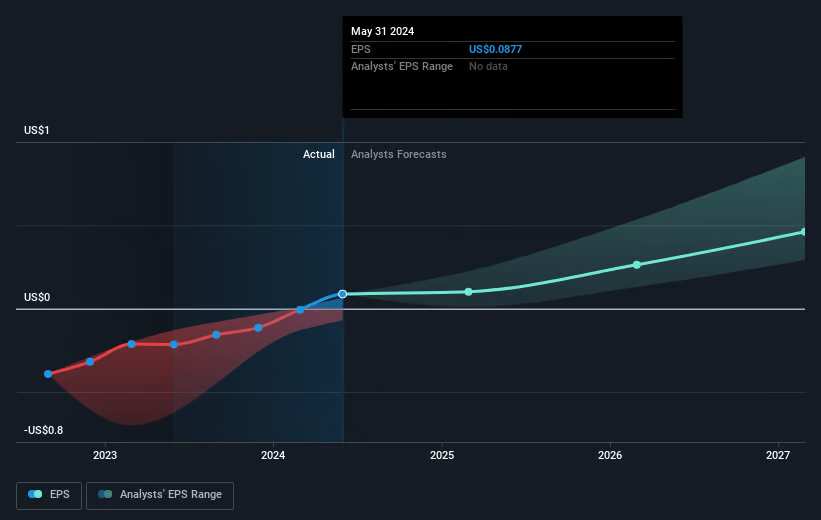
TAL Education Group became profitable within the last three years. That would generally be considered a positive, so we'd expect the share price to be up.
好未來集團在過去三年內實現了盈利。這通常被認爲是一個積極的因素,因此我們預計股價會上漲。
The company's earnings per share (over time) is depicted in the image below (click to see the exact numbers).
該公司的每股收益(隨時間的推移)如下圖所示(單擊可查看確切數字)。
We know that TAL Education Group has improved its bottom line over the last three years, but what does the future have in store? You can see how its balance sheet has strengthened (or weakened) over time in this free interactive graphic.
我們知道好未來教育集團在過去三年中改善了其底線,但未來會怎樣呢?您可以通過這個免費的互動圖形看到其資產負債表如何隨時間變化而增強(或削弱)。
A Different Perspective
不同的觀點
TAL Education Group provided a TSR of 29% over the year. That's fairly close to the broader market return. To take a positive view, the gain is pleasing, and it sure beats annualized TSR loss of 12%, which was endured over half a decade. While 'turnarounds seldom turn' there are green shoots for TAL Education Group. It's always interesting to track share price performance over the longer term. But to understand TAL Education Group better, we need to consider many other factors. For example, we've discovered 1 warning sign for TAL Education Group that you should be aware of before investing here.
好未來教育集團提供了29%的總股票回報率。這與整個市場回報率相當接近。積極看待,這種收益令人滿意,肯定比過去五年中承受的每年化總股票回報率虧損12%要好。雖然『轉機很少能成功』,但對於好未來教育集團來說,確實有一些積極跡象。長期跟蹤股價表現總是很有趣。但要更好地了解好未來教育集團,我們需要考慮許多其他因素。例如,在您在此投資之前,我們發現了一個警示信號,您應該注意。
Of course, you might find a fantastic investment by looking elsewhere. So take a peek at this free list of companies we expect will grow earnings.
當然,您可能在其他地方找到一家出色的企業進行投資。因此,請查看我們預計將實現盈利增長的公司的免費列表。
Please note, the market returns quoted in this article reflect the market weighted average returns of stocks that currently trade on American exchanges.
請注意,本文所引述的市場回報反映了目前在美國交易所上市的股票的市場加權平均回報。
Have feedback on this article? Concerned about the content? Get in touch with us directly. Alternatively, email editorial-team (at) simplywallst.com.
This article by Simply Wall St is general in nature. We provide commentary based on historical data and analyst forecasts only using an unbiased methodology and our articles are not intended to be financial advice. It does not constitute a recommendation to buy or sell any stock, and does not take account of your objectives, or your financial situation. We aim to bring you long-term focused analysis driven by fundamental data. Note that our analysis may not factor in the latest price-sensitive company announcements or qualitative material. Simply Wall St has no position in any stocks mentioned.
對本文有任何反饋?對內容有任何疑慮?請直接與我們聯繫。或者,發送電子郵件至editorial-team@simplywallst.com。
這篇文章是Simply Wall St的一般性文章。我們根據歷史數據和分析師預測提供評論,只使用公正的方法論,我們的文章並不意味着提供任何金融建議。文章不構成買賣任何股票的建議,也不考慮您的目標或您的財務狀況。我們的目標是帶給您基本數據驅動的長期關注分析。請注意,我們的分析可能不考慮最新的價格敏感公司公告或定性材料。Simply Wall St沒有任何股票頭寸。
譯文內容由第三人軟體翻譯。