
Is Skyward Specialty Insurance Group, Inc.'s (NASDAQ:SKWD) Latest Stock Performance Being Led By Its Strong Fundamentals?
Is Skyward Specialty Insurance Group, Inc.'s (NASDAQ:SKWD) Latest Stock Performance Being Led By Its Strong Fundamentals?
 Return on Equity = Net Profit (from continuing operations) ÷ Shareholders' Equity
 Skyward Specialty Insurance Group's (NASDAQ:SKWD) stock is up by 7.3% over the past three months. Given its impressive performance, we decided to study the company's key financial indicators as a company's long-term fundamentals usually dictate market outcomes. Specifically, we decided to study Skyward Specialty Insurance Group's ROE in this article.
Skyward Specialty Insurance Group (納斯達克:SKWD)的股票在過去三個月中上漲了7.3%。鑑於其出色的表現,我們決定研究該公司的關鍵財務指標,因爲公司的長期基本面通常決定市場結果。具體而言,我們決定在本文中研究Skyward Specialty Insurance Group的roe。
ROE or return on equity is a useful tool to assess how effectively a company can generate returns on the investment it received from its shareholders. Simply put, it is used to assess the profitability of a company in relation to its equity capital.
roe或股東權益回報率是評估公司如何有效地從股東那裏獲得回報的有用工具。簡而言之,它用於評估公司相對於其權益資本的盈利能力。
How Do You Calculate Return On Equity?
怎樣計算ROE?
ROE can be calculated by using the formula:
淨資產收益率可以使用以下公式進行計算:
Return on Equity = Net Profit (from continuing operations) ÷ Shareholders' Equity
淨資產收益率 = 淨利潤(從持續經營中獲得)÷ 股東權益
So, based on the above formula, the ROE for Skyward Specialty Insurance Group is:
因此,根據上述公式,Skyward Specialty Insurance Group的roe爲:
16% = US$119m ÷ US$724m (Based on the trailing twelve months to June 2024).
16% = 1.19億美元 ÷ 7.24億美元(基於截至2024年6月的過去十二個月)。
The 'return' is the amount earned after tax over the last twelve months. So, this means that for every $1 of its shareholder's investments, the company generates a profit of $0.16.
「回報」是指過去12個月稅後賺取的金額。這意味着對於每美元股東的投資,該公司就會產生0.16美元的利潤。
What Is The Relationship Between ROE And Earnings Growth?
ROE與盈利增長之間的關係是什麼?
Thus far, we have learned that ROE measures how efficiently a company is generating its profits. Depending on how much of these profits the company reinvests or "retains", and how effectively it does so, we are then able to assess a company's earnings growth potential. Assuming all else is equal, companies that have both a higher return on equity and higher profit retention are usually the ones that have a higher growth rate when compared to companies that don't have the same features.
到目前爲止,我們已經學到 ROE(淨資產收益率)可以衡量公司盈利的效率。具體取決於公司再投資或「保留」多少這些利潤,以及其有效程度,我們便能夠評估公司的盈利增長潛力。假設其他條件相同,ROE和利潤保留率都較高的公司通常比不具備這些特徵的公司增長率更高。
A Side By Side comparison of Skyward Specialty Insurance Group's Earnings Growth And 16% ROE
Skyward Specialty Insurance Group的盈利增長和16%的ROE的並排比較
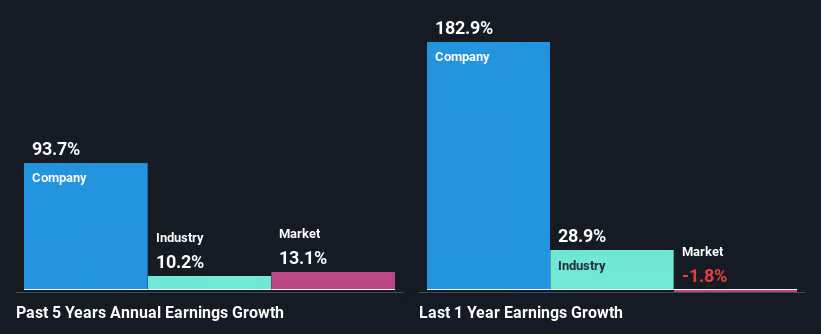
To begin with, Skyward Specialty Insurance Group seems to have a respectable ROE. On comparing with the average industry ROE of 13% the company's ROE looks pretty remarkable. This probably laid the ground for Skyward Specialty Insurance Group's significant 94% net income growth seen over the past five years. We reckon that there could also be other factors at play here. For instance, the company has a low payout ratio or is being managed efficiently.
首先,Skyward Specialty Insurance Group的ROE似乎是令人尊敬的。與行業平均ROE的13%相比,該公司的ROE相當可觀。這可能爲Skyward Specialty Insurance Group過去五年中顯着的淨利潤增長奠定了基礎。我們認爲這裏也可能還有其他因素在起作用。例如,公司的派息比率較低或者是被有效管理。
Next, on comparing with the industry net income growth, we found that Skyward Specialty Insurance Group's growth is quite high when compared to the industry average growth of 10% in the same period, which is great to see.
接下來,與行業淨利潤增長相比,我們發現Skyward Specialty Insurance Group的增長在同一期間相對較高,相比於行業平均增長的10%,這是令人高興的。
Earnings growth is an important metric to consider when valuing a stock. What investors need to determine next is if the expected earnings growth, or the lack of it, is already built into the share price. By doing so, they will have an idea if the stock is headed into clear blue waters or if swampy waters await. One good indicator of expected earnings growth is the P/E ratio which determines the price the market is willing to pay for a stock based on its earnings prospects. So, you may want to check if Skyward Specialty Insurance Group is trading on a high P/E or a low P/E, relative to its industry.
收益增長是估值股票時需要考慮的重要指標。投資者需要判斷的下一步是預期的收益增長是否已經融入股價。通過這樣做,他們將了解股票是朝着明朗的未來前進,還是即將面臨困難。一個預期收益增長的好指標是市盈率,根據股票的收益前景,決定市場願意出多少來買入一支股票。所以,您可能想要檢查Skyward Specialty Insurance Group的市盈率是否高於行業水平或低於行業水平。
Is Skyward Specialty Insurance Group Efficiently Re-investing Its Profits?
Skyward Specialty Insurance Group是否有效地重新投資其利潤?
Skyward Specialty Insurance Group doesn't pay any regular dividends to its shareholders, meaning that the company has been reinvesting all of its profits into the business. This is likely what's driving the high earnings growth number discussed above.
Skyward Specialty Insurance Group不向股東支付任何普通股息,這意味着公司一直在將所有利潤重新投資到業務中。這可能是上面討論的高收益增長數字的原因。
Conclusion
結論
In total, we are pretty happy with Skyward Specialty Insurance Group's performance. In particular, it's great to see that the company is investing heavily into its business and along with a high rate of return, that has resulted in a sizeable growth in its earnings. That being so, a study of the latest analyst forecasts show that the company is expected to see a slowdown in its future earnings growth. To know more about the latest analysts predictions for the company, check out this visualization of analyst forecasts for the company.
總體而言,我們對Skyward Specialty Insurance Group的業績非常滿意。特別是,公司大量投資業務,以及高回報率,這導致了收益的可觀增長。即使如此,對於最新的分析師預測顯示,公司未來的收益增長有所放緩。要了解有關該公司的最新分析師預測的更多信息,請查看該公司的分析師預測可視化圖。
Have feedback on this article? Concerned about the content? Get in touch with us directly. Alternatively, email editorial-team (at) simplywallst.com.
This article by Simply Wall St is general in nature. We provide commentary based on historical data and analyst forecasts only using an unbiased methodology and our articles are not intended to be financial advice. It does not constitute a recommendation to buy or sell any stock, and does not take account of your objectives, or your financial situation. We aim to bring you long-term focused analysis driven by fundamental data. Note that our analysis may not factor in the latest price-sensitive company announcements or qualitative material. Simply Wall St has no position in any stocks mentioned.
對本文有任何反饋?對內容有任何疑慮?請直接與我們聯繫。或者,發送電子郵件至editorial-team@simplywallst.com。
這篇文章是Simply Wall St的一般性文章。我們根據歷史數據和分析師預測提供評論,只使用公正的方法論,我們的文章並不意味着提供任何金融建議。文章不構成買賣任何股票的建議,也不考慮您的目標或您的財務狀況。我們的目標是帶給您基本數據驅動的長期關注分析。請注意,我們的分析可能不考慮最新的價格敏感公司公告或定性材料。Simply Wall St沒有任何股票頭寸。
譯文內容由第三人軟體翻譯。