
Calculating The Intrinsic Value Of Sterling Infrastructure, Inc. (NASDAQ:STRL)
Calculating The Intrinsic Value Of Sterling Infrastructure, Inc. (NASDAQ:STRL)
Key Insights
主要見解
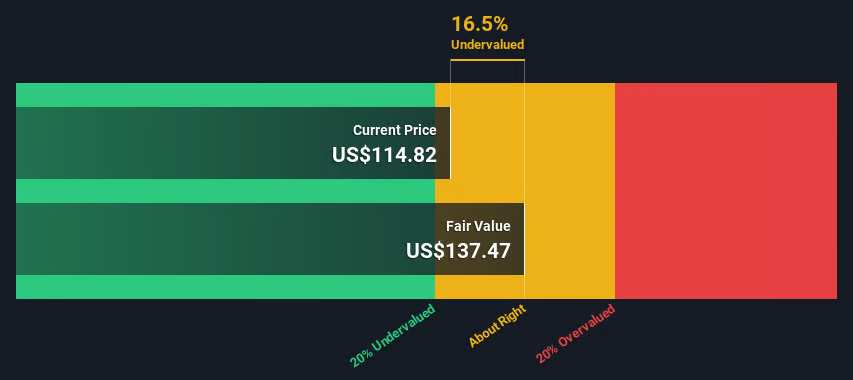
- The projected fair value for Sterling Infrastructure is US$137 based on 2 Stage Free Cash Flow to Equity
- With US$115 share price, Sterling Infrastructure appears to be trading close to its estimated fair value
- When compared to theindustry average discount to fair value of 15%, Sterling Infrastructure's competitors seem to be trading at a lesser discount
- 基於兩階段自由現金流的權益,Sterling Infrastructure的預計公允價值爲137美元。
- 以115美元的股價來看,Sterling Infrastructure的交易價格似乎接近其估計的公允價值。
- 與行業平均折價率15%相比,Sterling Infrastructure的競爭對手似乎以更低的折價率交易。
In this article we are going to estimate the intrinsic value of Sterling Infrastructure, Inc. (NASDAQ:STRL) by projecting its future cash flows and then discounting them to today's value. We will use the Discounted Cash Flow (DCF) model on this occasion. Models like these may appear beyond the comprehension of a lay person, but they're fairly easy to follow.
在本文中,我們將通過預測Sterling Infrastructure, Inc.(NASDAQ: STRL)的未來現金流並對其進行貼現,來估計其內在價值。這次我們將使用貼現現金流模型(DCF)。這些模型可能超出一個外行人的理解範圍,但它們相當容易理解。
We would caution that there are many ways of valuing a company and, like the DCF, each technique has advantages and disadvantages in certain scenarios. Anyone interested in learning a bit more about intrinsic value should have a read of the Simply Wall St analysis model.
我們要提醒的是,估值公司有很多方法,像DCF一樣,每種技術在某些情況下都有優點和缺點。有興趣了解內在價值的人應該讀一下Simply Wall St的分析模型。
Is Sterling Infrastructure Fairly Valued?
Sterling Infrastructure是否定價合理?
We're using the 2-stage growth model, which simply means we take in account two stages of company's growth. In the initial period the company may have a higher growth rate and the second stage is usually assumed to have a stable growth rate. To begin with, we have to get estimates of the next ten years of cash flows. Where possible we use analyst estimates, but when these aren't available we extrapolate the previous free cash flow (FCF) from the last estimate or reported value. We assume companies with shrinking free cash flow will slow their rate of shrinkage, and that companies with growing free cash flow will see their growth rate slow, over this period. We do this to reflect that growth tends to slow more in the early years than it does in later years.
我們使用2階段增長模型,這意味着我們考慮公司的兩個增長階段。在最初的階段,公司的增長率可能會更高,在第二個階段通常被認爲具有穩定的增長率。首先,我們必須獲得未來十年的現金流量預測值。在可能的情況下,我們使用分析師的預測,但當這些不可用時,我們將推算出前期股息的自由現金流(FCF)。我們假設自由現金流減少的公司將減緩其減少速度,並且自由現金流增加的公司將在此期間看到其增長率減緩。我們這樣做是爲了反映增長在早期年份比後來的年份更容易放緩的現象。
Generally we assume that a dollar today is more valuable than a dollar in the future, so we discount the value of these future cash flows to their estimated value in today's dollars:
通常我們認爲今天的一美元比未來的一美元更有價值,因此我們將這些未來的現金流折現爲今天的估計價值:
10-year free cash flow (FCF) forecast
10年自由現金流(FCF)預測
| 2025 | 2026 | 2027 | 2028 | 2029 | 2030 | 2031 | 2032 | 2033 | 2034 | |
| Levered FCF ($, Millions) | US$239.6m | US$223.6m | US$215.4m | US$211.4m | US$210.3m | US$211.1m | US$213.2m | US$216.3m | US$220.2m | US$224.5m |
| Growth Rate Estimate Source | Analyst x2 | Analyst x1 | Est @ -3.69% | Est @ -1.83% | Est @ -0.53% | Est @ 0.38% | Est @ 1.01% | Est @ 1.46% | Est @ 1.77% | Est @ 1.99% |
| Present Value ($, Millions) Discounted @ 6.9% | US$224 | US$196 | US$176 | US$162 | US$151 | US$141 | US$134 | US$127 | US$121 | US$115 |
| 2025 | 2026 | 2027 | 2028 | 2029 | 2030 | 2031 | 2032 | 2033 | 2034 | |
| 槓桿自由現金流 ($, 百萬) | ("Est" = FCF growth rate estimated by Simply Wall St) | 2.236億美元 | 美元215.4百萬 | 211.4百萬美元 | 2.10億美元 | 211.1美元 | 儘管重要,DCF計算通常不應作爲您對一家公司進行詳細考察的唯一分析工具。DCF模型並不是一種完美的股票估值工具。最好是應用不同的情況和假設,看看它們如何影響公司的估值。例如,公司的權益成本或無風險利率的變化可能會對估值產生顯著影響。對於Sterling Infrastructure,有三個重要因素您應該考慮: | 2.163億美元 | Other Solid Businesses: Low debt, high returns on equity and good past performance are fundamental to a strong business. Why not explore our interactive list of stocks with solid business fundamentals to see if there are other companies you may not have considered! | PS. The Simply Wall St app conducts a discounted cash flow valuation for every stock on the NASDAQGS every day. If you want to find the calculation for other stocks just search here. |
| 增長率估計來源 | 分析師x2 | 分析師x1 | 預計@-3.69% | 估計值爲-1.83%。 | 預計爲-0.53% | 估算值@ 0.38% | 估值爲1.01% | 估計@ 1.46% | 預計爲1.77%。 | 以預計的1.99%增長,康明斯公司估值爲2.7億美元 |
| 現值($,百萬)以6.9%的折現率折現 | 224美元 | 196美元。 | 176 | 162美元 | 151美元 | 美元141 | 134美元 | 美元127 | 121美元 | 115美元 |
("Est" = FCF growth rate estimated by Simply Wall St)
Present Value of 10-year Cash Flow (PVCF) = US$1.5b
("Est" = Simply Wall St 估計的自由現金流增長率)
10年現金流的現值(PVCF)=1.5億美元
After calculating the present value of future cash flows in the initial 10-year period, we need to calculate the Terminal Value, which accounts for all future cash flows beyond the first stage. The Gordon Growth formula is used to calculate Terminal Value at a future annual growth rate equal to the 5-year average of the 10-year government bond yield of 2.5%. We discount the terminal cash flows to today's value at a cost of equity of 6.9%.
Terminal Value (TV)= FCF2034 × (1 + g) ÷ (r – g) = US$225m× (1 + 2.5%) ÷ (6.9%– 2.5%) = US$5.2b
Present Value of Terminal Value (PVTV)= TV / (1 + r)10= US$5.2b÷ ( 1 + 6.9%)10= US$2.7b
The total value is the sum of cash flows for the next ten years plus the discounted terminal value, which results in the Total Equity Value, which in this case is US$4.2b. In the final step we divide the equity value by the number of shares outstanding. Compared to the current share price of US$115, the company appears about fair value at a 16% discount to where the stock price trades currently. Remember though, that this is just an approximate valuation, and like any complex formula - garbage in, garbage out.
Important Assumptions
重要假設
The calculation above is very dependent on two assumptions. The first is the discount rate and the other is the cash flows. If you don't agree with these result, have a go at the calculation yourself and play with the assumptions. The DCF also does not consider the possible cyclicality of an industry, or a company's future capital requirements, so it does not give a full picture of a company's potential performance. Given that we are looking at Sterling Infrastructure as potential shareholders, the cost of equity is used as the discount rate, rather than the cost of capital (or weighted average cost of capital, WACC) which accounts for debt. In this calculation we've used 6.9%, which is based on a levered beta of 1.069. Beta is a measure of a stock's volatility, compared to the market as a whole. We get our beta from the industry average beta of globally comparable companies, with an imposed limit between 0.8 and 2.0, which is a reasonable range for a stable business.
Moving On:
接下來:
Whilst important, the DCF calculation ideally won't be the sole piece of analysis you scrutinize for a company. The DCF model is not a perfect stock valuation tool. Preferably you'd apply different cases and assumptions and see how they would impact the company's valuation. For example, changes in the company's cost of equity or the risk free rate can significantly impact the valuation. For Sterling Infrastructure, there are three important elements you should consider:
- Financial Health: Does STRL have a healthy balance sheet? Take a look at our free balance sheet analysis with six simple checks on key factors like leverage and risk.
- Future Earnings: How does STRL's growth rate compare to its peers and the wider market? Dig deeper into the analyst consensus number for the upcoming years by interacting with our free analyst growth expectation chart.
- Other Solid Businesses: Low debt, high returns on equity and good past performance are fundamental to a strong business. Why not explore our interactive list of stocks with solid business fundamentals to see if there are other companies you may not have considered!
- 其他優秀企業:低負債,高股本回報率和良好的過去業績是構建強大企業基礎的基礎。爲什麼不探索我們交互式的股票列表,其中包括具有堅實業務基礎的其他公司?
PS. The Simply Wall St app conducts a discounted cash flow valuation for every stock on the NASDAQGS every day. If you want to find the calculation for other stocks just search here.
PS。Simply Wall St 應用程序每天針對納斯達克股票市場上的每隻股票進行現金流折現估值。如果您想找到其他股票的計算,請在此處搜索。
Have feedback on this article? Concerned about the content? Get in touch with us directly. Alternatively, email editorial-team (at) simplywallst.com.
This article by Simply Wall St is general in nature. We provide commentary based on historical data and analyst forecasts only using an unbiased methodology and our articles are not intended to be financial advice. It does not constitute a recommendation to buy or sell any stock, and does not take account of your objectives, or your financial situation. We aim to bring you long-term focused analysis driven by fundamental data. Note that our analysis may not factor in the latest price-sensitive company announcements or qualitative material. Simply Wall St has no position in any stocks mentioned.
對本文有任何反饋?對內容有任何疑慮?請直接與我們聯繫。或者,發送電子郵件至editorial-team@simplywallst.com。
這篇文章是Simply Wall St的一般性文章。我們根據歷史數據和分析師預測提供評論,只使用公正的方法論,我們的文章並不意味着提供任何金融建議。文章不構成買賣任何股票的建議,也不考慮您的目標或您的財務狀況。我們的目標是帶給您基本數據驅動的長期關注分析。請注意,我們的分析可能不考慮最新的價格敏感公司公告或定性材料。Simply Wall St沒有任何股票頭寸。
譯文內容由第三人軟體翻譯。