
Analyzing Palantir Technologies In Comparison To Competitors In Software Industry
Analyzing Palantir Technologies In Comparison To Competitors In Software Industry
In today's rapidly changing and fiercely competitive business landscape, it is vital for investors and industry enthusiasts to carefully evaluate companies. In this article, we will perform a comprehensive industry comparison, evaluating Palantir Technologies (NYSE:PLTR) against its key competitors in the Software industry. By analyzing important financial metrics, market position, and growth prospects, we aim to provide valuable insights for investors and shed light on company's performance within the industry.
在當今瞬息萬變且競爭激烈的商業格局中,投資者和行業愛好者仔細評估公司至關重要。在本文中,我們將進行全面的行業比較,評估Palantir Technologies(紐約證券交易所代碼:PLTR)與其在軟件行業的主要競爭對手。通過分析重要的財務指標、市場地位和增長前景,我們的目標是爲投資者提供寶貴的見解,並闡明公司在行業內的表現。
Palantir Technologies Background
Palantir 科技背景
Palantir is an analytical software company that focuses on leveraging data to create efficiencies in its clients' organizations. The firm serves commercial and government clients via its Foundry and Gotham platforms, respectively. The Denver-based company was founded in 2003 and went public in 2020.
Palantir是一家分析軟件公司,專注於利用數據來提高客戶組織的效率。該公司分別通過其Foundry和Gotham平台爲商業和政府客戶提供服務。這家總部位於丹佛的公司成立於2003年,並於2020年上市。
| Company | P/E | P/B | P/S | ROE | EBITDA (in billions) | Gross Profit (in billions) | Revenue Growth |
|---|---|---|---|---|---|---|---|
| Palantir Technologies Inc | 191.18 | 17.97 | 31.14 | 3.43% | $0.11 | $0.55 | 27.15% |
| Salesforce Inc | 47.73 | 4.31 | 7.30 | 2.57% | $2.6 | $6.97 | 10.74% |
| SAP SE | 91.94 | 5.56 | 7.17 | 2.1% | $1.94 | $6.02 | 9.72% |
| Adobe Inc | 50.69 | 16.82 | 12.58 | 10.38% | $2.19 | $4.71 | 10.24% |
| Intuit Inc | 61.30 | 9.89 | 11.90 | 13.4% | $3.34 | $5.67 | 11.95% |
| Synopsys Inc | 60.87 | 11.96 | 13.75 | 4.23% | $0.41 | $1.15 | 15.2% |
| Cadence Design Systems Inc | 73.05 | 18.12 | 18.50 | 5.86% | $0.38 | $0.92 | 8.61% |
| Workday Inc | 41.47 | 7.56 | 8.23 | 1.32% | $0.23 | $1.5 | 18.17% |
| Roper Technologies Inc | 41.10 | 3.25 | 9.01 | 1.88% | $0.69 | $1.19 | 12.12% |
| Autodesk Inc | 54.59 | 25.04 | 9.62 | 12.55% | $0.34 | $1.28 | 11.66% |
| Datadog Inc | 249.38 | 16.42 | 18.03 | 1.9% | $0.06 | $0.52 | 26.66% |
| AppLovin Corp | 36.67 | 35.20 | 7.60 | 39.35% | $0.51 | $0.8 | 43.98% |
| Ansys Inc | 57.76 | 5.11 | 12.32 | 2.37% | $0.2 | $0.52 | 19.64% |
| Tyler Technologies Inc | 120 | 7.90 | 12.30 | 2.2% | $0.12 | $0.24 | 7.28% |
| PTC Inc | 71.98 | 7.03 | 9.58 | 2.32% | $0.13 | $0.41 | -4.37% |
| Zoom Video Communications Inc | 22.07 | 2.23 | 4.08 | 2.65% | $0.23 | $0.87 | 3.25% |
| Manhattan Associates Inc | 79.19 | 66.11 | 16.28 | 21.98% | $0.07 | $0.15 | 14.85% |
| Bentley Systems Inc | 43.72 | 15.44 | 13.04 | 7.52% | $0.1 | $0.27 | 11.32% |
| Dynatrace Inc | 96.02 | 7.19 | 10.02 | 1.89% | $0.06 | $0.32 | 19.93% |
| Average | 72.2 | 14.73 | 11.18 | 7.58% | $0.76 | $1.86 | 13.94% |
| 公司 | P/E | P/B | 市銷率 | 羅伊 | 息稅折舊攤銷前利潤(單位:十億) | 毛利(單位:十億) | 收入增長 |
|---|---|---|---|---|---|---|---|
| 帕蘭蒂爾科技公司 | 191.18 | 17.97 | 31.14 | 3.43% | 0.11 美元 | 0.55 美元 | 27.15% |
| Salesforce | 47.73 | 4.31 | 7.30 | 2.57% | 2.6 美元 | 6.97 美元 | 10.74% |
| 肥皂性交 | 91.94 | 5.56 | 7.17 | 2.1% | 1.94 美元 | 6.02 美元 | 9.72% |
| Adobe | 50.69 | 16.82 | 12.58 | 10.38% | 2.19 美元 | 4.71 美元 | 10.24% |
| Intuit Inc | 61.30 | 9.89 | 11.90 | 13.4% | 3.34 美元 | 5.67 美元 | 11.95% |
| 新思科技公司 | 60.87 | 11.96 | 13.75 | 4.23% | 0.41 美元 | 1.15 美元 | 15.2% |
| Cadence 設計系統公司 | 73.05 | 18.12 | 18.50 | 5.86% | 0.38 美元 | 0.92 美元 | 8.61% |
| Workday公司 | 41.47 | 7.56 | 8.23 | 1.32% | 0.23 美元 | 1.5 美元 | 18.17% |
| 羅珀科技公司 | 41.10 | 3.25 | 9.01 | 1.88% | 0.69 美元 | 1.19 美元 | 12.12% |
| Autodesk公司 | 54.59 | 25.04 | 9.62 | 12.55% | 0.34 美元 | 1.28 美元 | 11.66% |
| Datadog Inc | 249.38 | 16.42 | 18.03 | 1.9% | 0.06 美元 | 0.52 美元 | 26.66% |
| AppLovin 公司 | 36.67 | 35.20 | 7.60 | 39.35% | 0.51 美元 | 0.8 美元 | 43.98% |
| Ansys Inc | 57.76 | 5.11 | 12.32 | 2.37% | 0.2 美元 | 0.52 美元 | 19.64% |
| 泰勒科技公司 | 120 | 7.90 | 12.30 | 2.2% | 0.12 美元 | 0.24 美元 | 7.28% |
| PTC Inc. | 71.98 | 7.03 | 9.58 | 2.32% | 0.13 美元 | 0.41 美元 | -4.37% |
| Zoom 視頻通信公司 | 22.07 | 2.23 | 4.08 | 2.65% | 0.23 美元 | 0.87 美元 | 3.25% |
| 曼哈頓聯合公司 | 79.19 | 66.11 | 16.28 | 21.98% | 0.07 美元 | 0.15 美元 | 14.85% |
| 賓利系統公司 | 43.72 | 15.44 | 13.04 | 7.52% | 0.1 美元 | 0.27 | 11.32% |
| Dynatrace Inc | 96.02 | 7.19 | 10.02 | 1.89% | 0.06 美元 | 0.32 美元 | 19.93% |
| 平均值 | 72.2 | 14.73 | 11.18 | 7.58% | 0.76 美元 | 1.86 美元 | 13.94% |
After a detailed analysis of Palantir Technologies, the following trends become apparent:
在對Palantir Technologies進行了詳細分析之後,以下趨勢變得顯而易見:
Notably, the current Price to Earnings ratio for this stock, 191.18, is 2.65x above the industry norm, reflecting a higher valuation relative to the industry.
The elevated Price to Book ratio of 17.97 relative to the industry average by 1.22x suggests company might be overvalued based on its book value.
The stock's relatively high Price to Sales ratio of 31.14, surpassing the industry average by 2.79x, may indicate an aspect of overvaluation in terms of sales performance.
The Return on Equity (ROE) of 3.43% is 4.15% below the industry average, suggesting potential inefficiency in utilizing equity to generate profits.
Compared to its industry, the company has lower Earnings Before Interest, Taxes, Depreciation, and Amortization (EBITDA) of $110 Million, which is 0.14x below the industry average, potentially indicating lower profitability or financial challenges.
The gross profit of $550 Million is 0.3x below that of its industry, suggesting potential lower revenue after accounting for production costs.
The company is experiencing remarkable revenue growth, with a rate of 27.15%, outperforming the industry average of 13.94%.
值得注意的是,該股票目前的市盈率爲191.18,比行業標準高出2.65倍,反映出相對於該行業的估值更高。
市值與賬面比率相對於行業平均水平提高了1.22倍,爲17.97,這表明該公司的賬面價值可能會被高估。
該股相對較高的市售比率爲31.14,比行業平均水平高出2.79倍,這可能表明在銷售業績方面存在估值過高的情況。
股本回報率(ROE)爲3.43%,比行業平均水平低4.15%,這表明在利用股權創造利潤方面可能效率低下。
與同行業相比,該公司的扣除利息、稅項、折舊和攤銷前的收益(EBITDA)較低,爲1.1億美元,比行業平均水平低0.14倍,這可能表明盈利能力下降或面臨財務挑戰。
5.5億美元的毛利比該行業的毛利低0.3倍,這表明扣除生產成本後,收入可能會減少。
該公司的收入正在顯著增長,增長率爲27.15%,超過了行業平均水平的13.94%。
Debt To Equity Ratio
負債權益比率
The debt-to-equity (D/E) ratio helps evaluate the capital structure and financial leverage of a company.
債務與權益(D/E)比率有助於評估公司的資本結構和財務槓桿率。
Considering the debt-to-equity ratio in industry comparisons allows for a concise evaluation of a company's financial health and risk profile, aiding in informed decision-making.
在行業比較中考慮債務與權益比率可以對公司的財務狀況和風險狀況進行簡明的評估,從而有助於做出明智的決策。
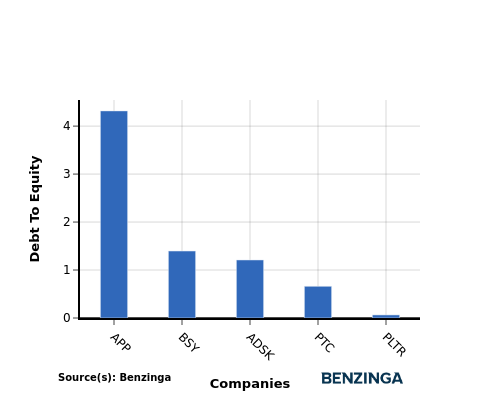
When examining Palantir Technologies in comparison to its top 4 peers with respect to the Debt-to-Equity ratio, the following information becomes apparent:
在將Palantir Technologies與排名前四的同行進行比較時,以下信息變得顯而易見:
Compared to its top 4 peers, Palantir Technologies has a stronger financial position indicated by its lower debt-to-equity ratio of 0.06.
This suggests that the company relies less on debt financing and has a more favorable balance between debt and equity, which can be seen as a positive attribute by investors.
與排名前四的同行相比,Palantir Technologies的財務狀況更強,其債務與權益比率較低,爲0.06。
這表明該公司減少了對債務融資的依賴,在債務和股權之間取得了更有利的平衡,這可以被投資者視爲一個積極的屬性。
Key Takeaways
關鍵要點
For Palantir Technologies, the PE, PB, and PS ratios are all high compared to its peers in the Software industry, indicating potentially overvalued stock. On the other hand, the low ROE, EBITDA, and gross profit suggest lower profitability levels compared to industry peers. However, the high revenue growth rate may indicate potential for future growth and market expansion.
對於Palantir Technologies而言,與軟件行業的同行相比,市盈率、市盈率和市盈率都很高,這表明股票可能被高估了。另一方面,與業內同行相比,低的投資回報率、息稅折舊攤銷前利潤和毛利潤表明盈利水平較低。但是,高收入增長率可能表明未來增長和市場擴張的潛力。
This article was generated by Benzinga's automated content engine and reviewed by an editor.
本文由Benzinga的自動內容引擎生成,並由編輯審閱。
譯文內容由第三人軟體翻譯。