
Those Who Invested in Valmont Industries (NYSE:VMI) Five Years Ago Are up 121%
Those Who Invested in Valmont Industries (NYSE:VMI) Five Years Ago Are up 121%
The worst result, after buying shares in a company (assuming no leverage), would be if you lose all the money you put in. But on the bright side, if you buy shares in a high quality company at the right price, you can gain well over 100%. For example, the Valmont Industries, Inc. (NYSE:VMI) share price has soared 110% in the last half decade. Most would be very happy with that. In the last week the share price is up 1.8%.
購買公司股票後(假設不使用槓桿),最差的結果就是你輸掉了所有投資。但是,如果你以合適的價格購買了高品質公司的股票,你可以獲得超過100%的收益。例如,維蒙特工業(紐交所股票代碼:VMI)的股價在過去的五年中飆升了110%。大多數人會爲此感到非常高興。在過去的一週裏,股價上漲了1.8%。
So let's assess the underlying fundamentals over the last 5 years and see if they've moved in lock-step with shareholder returns.
因此,讓我們評估過去5年的基本面,看看它們是否和股東的回報率相符。
To paraphrase Benjamin Graham: Over the short term the market is a voting machine, but over the long term it's a weighing machine. One way to examine how market sentiment has changed over time is to look at the interaction between a company's share price and its earnings per share (EPS).
用本傑明·格雷厄姆的話來說:「短期市場是一臺投票機,但長期市場是一臺稱重機」。檢查市場情緒如何隨時間推移變化的一種方式是查看公司股價和每股收益(EPS)之間的相互作用。
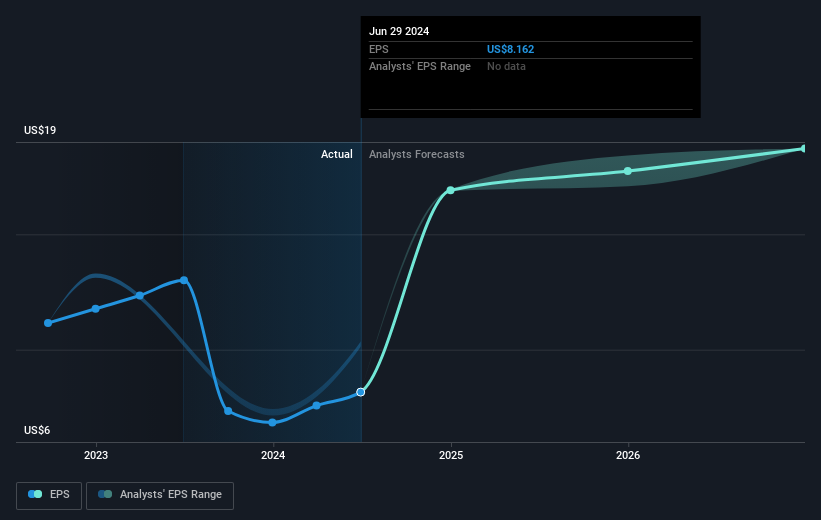
Over half a decade, Valmont Industries managed to grow its earnings per share at 13% a year. So the EPS growth rate is rather close to the annualized share price gain of 16% per year. That suggests that the market sentiment around the company hasn't changed much over that time. Indeed, it would appear the share price is reacting to the EPS.
在過去的五年中,維蒙特工業的每股收益年增長率達到了13%。因此,EPS增長率與年化股價增長率16%非常接近。這表明公司周圍的市場情緒在這段時間沒有發生多大變化。事實上,股價似乎正在對EPS做出反應。
The graphic below depicts how EPS has changed over time (unveil the exact values by clicking on the image).
下圖顯示了EPS隨時間變化的情況(點擊圖像以顯示確切值)。
It might be well worthwhile taking a look at our free report on Valmont Industries' earnings, revenue and cash flow.
您可能會有興趣查看我們有關維蒙特工業收益、營業收入和現金流的免費報告。
What About Dividends?
那麼分紅怎麼樣呢?
It is important to consider the total shareholder return, as well as the share price return, for any given stock. Whereas the share price return only reflects the change in the share price, the TSR includes the value of dividends (assuming they were reinvested) and the benefit of any discounted capital raising or spin-off. So for companies that pay a generous dividend, the TSR is often a lot higher than the share price return. As it happens, Valmont Industries' TSR for the last 5 years was 121%, which exceeds the share price return mentioned earlier. And there's no prize for guessing that the dividend payments largely explain the divergence!
對於任何給定的股票,重要的是考慮股東總回報和股票回報。股票回報只反映了股票價格的變化,TSR包括分紅派息的價值(假設它們被再投資)以及任何折價的資本籌集或剝離的好處。因此,對於支付慷慨的股息的公司,TSR通常比股票回報高得多。事實上,維蒙特工業在過去的5年中的TSR爲121%,超過了先前提到的股票回報。毫無疑問,分紅派息在很大程度上解釋了這種差異!
A Different Perspective
不同的觀點
Valmont Industries provided a TSR of 17% over the last twelve months. Unfortunately this falls short of the market return. It's probably a good sign that the company has an even better long term track record, having provided shareholders with an annual TSR of 17% over five years. It may well be that this is a business worth popping on the watching, given the continuing positive reception, over time, from the market. I find it very interesting to look at share price over the long term as a proxy for business performance. But to truly gain insight, we need to consider other information, too. To that end, you should be aware of the 4 warning signs we've spotted with Valmont Industries .
在過去的十二個月中,維蒙特工業的TSR爲17%,但不幸的是低於市場回報率。更好的是,公司在長期跟蹤記錄方面做得更好,爲股東提供了每年17%的TSR,連續五年。考慮到市場的持續正面反響,這可能是一個值得關注的企業。我非常有興趣查看股價的長期表現作爲業務績效的一種代理。但爲了真正獲得洞見,我們還需要考慮其他信息。爲此,您應該了解我們發現的維蒙特工業的4個預警信號。
Of course Valmont Industries may not be the best stock to buy. So you may wish to see this free collection of growth stocks.
當然,維蒙特工業可能不是最好的股票買入選擇。所以,您可能希望查看這個成長股的免費收藏。
Please note, the market returns quoted in this article reflect the market weighted average returns of stocks that currently trade on American exchanges.
請注意,本文所引述的市場回報反映了目前在美國交易所上市的股票的市場加權平均回報。
Have feedback on this article? Concerned about the content? Get in touch with us directly. Alternatively, email editorial-team (at) simplywallst.com.
This article by Simply Wall St is general in nature. We provide commentary based on historical data and analyst forecasts only using an unbiased methodology and our articles are not intended to be financial advice. It does not constitute a recommendation to buy or sell any stock, and does not take account of your objectives, or your financial situation. We aim to bring you long-term focused analysis driven by fundamental data. Note that our analysis may not factor in the latest price-sensitive company announcements or qualitative material. Simply Wall St has no position in any stocks mentioned.
對本文有任何反饋?對內容有任何疑慮?請直接與我們聯繫。或者,發送電子郵件至editorial-team@simplywallst.com。
這篇文章是Simply Wall St的一般性文章。我們根據歷史數據和分析師預測提供評論,只使用公正的方法論,我們的文章並不意味着提供任何金融建議。文章不構成買賣任何股票的建議,也不考慮您的目標或您的財務狀況。我們的目標是帶給您基本數據驅動的長期關注分析。請注意,我們的分析可能不考慮最新的價格敏感公司公告或定性材料。Simply Wall St沒有任何股票頭寸。
譯文內容由第三人軟體翻譯。