
PNM Resources (NYSE:PNM) Investors Are Sitting on a Loss of 4.3% If They Invested Five Years Ago
PNM Resources (NYSE:PNM) Investors Are Sitting on a Loss of 4.3% If They Invested Five Years Ago
 PNM Resources became profitable within the last five years. Most would consider that to be a good thing, so it's counter-intuitive to see the share price declining. Other metrics may better explain the share price move.
 PNM Resources, Inc. (NYSE:PNM) shareholders should be happy to see the share price up 15% in the last month. But if you look at the last five years the returns have not been good. You would have done a lot better buying an index fund, since the stock has dropped 18% in that half decade.
PNm Resources, Inc.(NYSE:PNM)的股東應該很高興看到股價在最近一個月內上漲了15%。但如果您看過去五年的回報率並不好。如果您購買指數基金,那麼您會做得更好,因爲這隻股票在那半個十年中下跌了18%。
With that in mind, it's worth seeing if the company's underlying fundamentals have been the driver of long term performance, or if there are some discrepancies.
鑑於此,值得看看該公司的基本面是否一直是長期業績的驅動因素,或者是否存在一些不一致之處。
There is no denying that markets are sometimes efficient, but prices do not always reflect underlying business performance. By comparing earnings per share (EPS) and share price changes over time, we can get a feel for how investor attitudes to a company have morphed over time.
市場有時候是有效的,但價格並不總是反映公司的基本業務表現。通過比較每股收益和股價變化,我們可以了解投資者對公司的看法如何隨着時間變化而變化。
PNM Resources became profitable within the last five years. Most would consider that to be a good thing, so it's counter-intuitive to see the share price declining. Other metrics may better explain the share price move.
PNm Resources在過去五年內實現了盈利。大多數人認爲這是一件好事,因此看到股價下跌是不符合直覺的。其他指數可能更好地解釋了股票價格的變動。
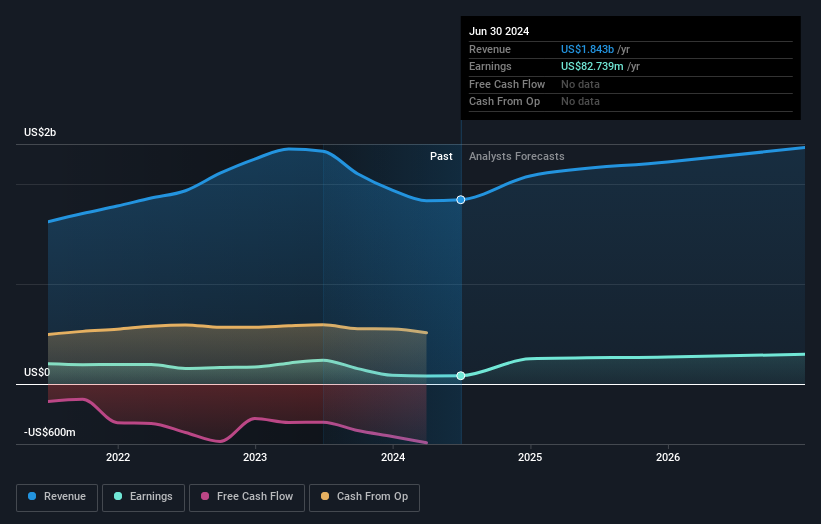
Revenue is actually up 8.9% over the time period. A more detailed examination of the revenue and earnings may or may not explain why the share price languishes; there could be an opportunity.
營業收入實際上在這段時間內增長了8.9%。對營收和收益進行更詳細的研究可能能夠解釋股價低迷的原因,也可能會爲您提供機會。
The graphic below depicts how earnings and revenue have changed over time (unveil the exact values by clicking on the image).
下面的圖表顯示了收益和營收隨時間的變化情況(通過單擊圖像揭示確切的值)。
Take a more thorough look at PNM Resources' financial health with this free report on its balance sheet.
通過此免費報告,更全面地了解PNm Resources的財務狀況。
What About Dividends?
那麼分紅怎麼樣呢?
As well as measuring the share price return, investors should also consider the total shareholder return (TSR). Whereas the share price return only reflects the change in the share price, the TSR includes the value of dividends (assuming they were reinvested) and the benefit of any discounted capital raising or spin-off. So for companies that pay a generous dividend, the TSR is often a lot higher than the share price return. In the case of PNM Resources, it has a TSR of -4.3% for the last 5 years. That exceeds its share price return that we previously mentioned. This is largely a result of its dividend payments!
除了衡量股價回報率之外,投資者還應考慮總股東回報率(TSR)。股價回報率僅反映了股價的變化,而TSR則包括分紅股價(假定它們被再投資)和任何折價資本籌集或分立的好處。因此,對於支付豐厚股息的公司,TSR通常比股價回報率高得多。在PNm資源的情況下,它在過去的5年中TSR爲-4.3%。超過了我們之前提到的股價回報率。這很大程度上是其分紅支付的結果!
A Different Perspective
不同的觀點
Investors in PNM Resources had a tough year, with a total loss of 2.1% (including dividends), against a market gain of about 23%. Even the share prices of good stocks drop sometimes, but we want to see improvements in the fundamental metrics of a business, before getting too interested. Unfortunately, last year's performance may indicate unresolved challenges, given that it was worse than the annualised loss of 0.8% over the last half decade. Generally speaking long term share price weakness can be a bad sign, though contrarian investors might want to research the stock in hope of a turnaround. It's always interesting to track share price performance over the longer term. But to understand PNM Resources better, we need to consider many other factors. Even so, be aware that PNM Resources is showing 5 warning signs in our investment analysis , and 1 of those is a bit concerning...
PNm資源的投資者度過了一個艱難的年份,總虧損爲2.1%(包括股息),而市場收益約爲23%。即使好股票的股價有時會下跌,但我們希望在對企業基本度量標準有所改善之前,看到企業的基本度量標準有所改善。不幸的是,去年的表現表明存在未解決的挑戰,因爲它比過去半個十年的年平均虧損0.8%更糟糕。一般來說,長期的股價疲軟可能是一個不好的跡象,儘管與衆不同的投資者可能想要研究股票,以期實現好轉。長期跟蹤股價表現總是很有趣的。但是爲了更好地了解PNm資源,我們需要考慮許多其他因素。即使如此,請注意,PNm資源在我們的投資分析中顯示出5個警示信號,其中1個有點令人擔憂......
For those who like to find winning investments this free list of undervalued companies with recent insider purchasing, could be just the ticket.
對於那些喜歡尋找獲勝投資的人來說,最近有內部購買的低估公司免費列表可能是一個很好的選擇。
Please note, the market returns quoted in this article reflect the market weighted average returns of stocks that currently trade on American exchanges.
請注意,本文所引述的市場回報反映了目前在美國交易所上市的股票的市場加權平均回報。
Have feedback on this article? Concerned about the content? Get in touch with us directly. Alternatively, email editorial-team (at) simplywallst.com.
This article by Simply Wall St is general in nature. We provide commentary based on historical data and analyst forecasts only using an unbiased methodology and our articles are not intended to be financial advice. It does not constitute a recommendation to buy or sell any stock, and does not take account of your objectives, or your financial situation. We aim to bring you long-term focused analysis driven by fundamental data. Note that our analysis may not factor in the latest price-sensitive company announcements or qualitative material. Simply Wall St has no position in any stocks mentioned.
對本文有任何反饋?對內容有任何疑慮?請直接與我們聯繫。或者,發送電子郵件至editorial-team@simplywallst.com。
這篇文章是Simply Wall St的一般性文章。我們根據歷史數據和分析師預測提供評論,只使用公正的方法論,我們的文章並不意味着提供任何金融建議。文章不構成買賣任何股票的建議,也不考慮您的目標或您的財務狀況。我們的目標是帶給您基本數據驅動的長期關注分析。請注意,我們的分析可能不考慮最新的價格敏感公司公告或定性材料。Simply Wall St沒有任何股票頭寸。
Have feedback on this article? Concerned about the content? Get in touch with us directly. Alternatively, email editorial-team@simplywallst.com
對本文有任何反饋?對內容有任何疑慮?請直接與我們聯繫。或者,發送電子郵件至editorial-team@simplywallst.com。
譯文內容由第三人軟體翻譯。
