
Investors Could Be Concerned With Olaplex Holdings' (NASDAQ:OLPX) Returns On Capital
Investors Could Be Concerned With Olaplex Holdings' (NASDAQ:OLPX) Returns On Capital
To find a multi-bagger stock, what are the underlying trends we should look for in a business? Ideally, a business will show two trends; firstly a growing return on capital employed (ROCE) and secondly, an increasing amount of capital employed. Ultimately, this demonstrates that it's a business that is reinvesting profits at increasing rates of return. However, after briefly looking over the numbers, we don't think Olaplex Holdings (NASDAQ:OLPX) has the makings of a multi-bagger going forward, but let's have a look at why that may be.
爲尋找潛力股,我們應該查找業務中的哪些趨勢呢?理想情況下,一個公司將展示兩個趨勢;首先是不斷增長的資本使用回報率(ROCE),其次是不斷增加的資本使用量。最終,這表明這是一家以逐漸提高回報率重新投資利潤的公司。然而,在簡要查看數字後,我們認爲Olaplex Holdings (納斯達克股票代碼:OLPX) 沒有成爲潛力股的跡象,但是讓我們看看原因。
Return On Capital Employed (ROCE): What Is It?
資本僱用回報率(ROCE)是什麼?
For those who don't know, ROCE is a measure of a company's yearly pre-tax profit (its return), relative to the capital employed in the business. The formula for this calculation on Olaplex Holdings is:
對於那些不了解ROCE的人,它是一個公司每年稅前利潤(其回報)與業務資本之比的衡量標準。在Olaplex Holdings上進行此計算的公式爲:
Return on Capital Employed = Earnings Before Interest and Tax (EBIT) ÷ (Total Assets - Current Liabilities)
資產僱用回報率(ROCE)是指企業利潤,即企業稅前利潤除以企業投入的總資本(負債加股權)。如果ROCE高於企業財務成本的承受能力,那麼企業就會創造出更多的價值。
0.06 = US$101m ÷ (US$1.8b - US$60m) (Based on the trailing twelve months to March 2024).
0.06 = 美元10100萬 ÷(美元18億 - 美元6000萬)(基於截至2024年3月的過去12個月).
Thus, Olaplex Holdings has an ROCE of 6.0%. In absolute terms, that's a low return and it also under-performs the Personal Products industry average of 17%.
因此,Olaplex Holdings的ROCE爲6.0%。以絕對值計算,這是一個較低的回報率,也低於個人護理產品行業的平均水平17%。
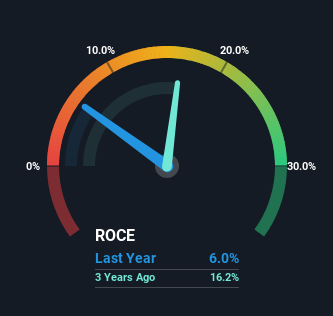
Above you can see how the current ROCE for Olaplex Holdings compares to its prior returns on capital, but there's only so much you can tell from the past. If you'd like, you can check out the forecasts from the analysts covering Olaplex Holdings for free.
上面您可以看到Olaplex Holdings目前的ROCE與以往資本回報率的比較,但過去只能說明那麼多。如果您想,您可以免費查看涵蓋Olaplex Holdings的分析師預測。
So How Is Olaplex Holdings' ROCE Trending?
那麼Olaplex Holdings的ROCE趨勢如何呢?
When we looked at the ROCE trend at Olaplex Holdings, we didn't gain much confidence. Over the last four years, returns on capital have decreased to 6.0% from 30% four years ago. Given the business is employing more capital while revenue has slipped, this is a bit concerning. This could mean that the business is losing its competitive advantage or market share, because while more money is being put into ventures, it's actually producing a lower return - "less bang for their buck" per se.
當我們查看Olaplex Holdings的ROCE趨勢時,我們沒有獲得太多信心。在過去的四年中,資本回報率從四年前的30%下降到6.0%。考慮到業務正在使用更多的資本,而營業收入卻有所下降,這有點令人擔憂。這可能意味着業務正在失去其競爭優勢或市場份額,因爲雖然投入了更多的資金,但實際上產生了較低的回報——“物超所值”。
The Key Takeaway
重要提示
In summary, we're somewhat concerned by Olaplex Holdings' diminishing returns on increasing amounts of capital. Investors haven't taken kindly to these developments, since the stock has declined 56% from where it was year ago. With underlying trends that aren't great in these areas, we'd consider looking elsewhere.
總之,我們對Olaplex Holdings逐漸減少的資本回報率感到有些擔憂。由於在這些領域內基本趨勢不佳,投資者並沒有對這些發展情況作出良好的反應,該股比一年前下跌了56%。考慮到這些領域內的趨勢不佳,我們應該考慮尋找其他投資機會。
On a final note, we've found 2 warning signs for Olaplex Holdings that we think you should be aware of.
最後,我們發現了有關Olaplex Holdings的兩個警告信號,認爲您應該注意。
For those who like to invest in solid companies, check out this free list of companies with solid balance sheets and high returns on equity.
Hao Tian International Construction Investment Group確實存在一些風險,我們已經發現了一條警示標誌,你可能會感興趣。對於那些喜歡投資於實力雄厚的公司的人,可以查看這個由財務狀況強大、股本回報率高的公司組成的免費列表。
Have feedback on this article? Concerned about the content? Get in touch with us directly. Alternatively, email editorial-team (at) simplywallst.com.
This article by Simply Wall St is general in nature. We provide commentary based on historical data and analyst forecasts only using an unbiased methodology and our articles are not intended to be financial advice. It does not constitute a recommendation to buy or sell any stock, and does not take account of your objectives, or your financial situation. We aim to bring you long-term focused analysis driven by fundamental data. Note that our analysis may not factor in the latest price-sensitive company announcements or qualitative material. Simply Wall St has no position in any stocks mentioned.
對本文有任何反饋?對內容有任何疑慮?請直接與我們聯繫。或者,發送電子郵件至editorial-team@simplywallst.com。
這篇文章是Simply Wall St的一般性文章。我們根據歷史數據和分析師預測提供評論,只使用公正的方法論,我們的文章並不意味着提供任何金融建議。文章不構成買賣任何股票的建議,也不考慮您的目標或您的財務狀況。我們的目標是帶給您基本數據驅動的長期關注分析。請注意,我們的分析可能不考慮最新的價格敏感公司公告或定性材料。Simply Wall St沒有任何股票頭寸。
Have feedback on this article? Concerned about the content? Get in touch with us directly. Alternatively, email editorial-team@simplywallst.com
對本文有任何反饋?對內容有任何疑慮?請直接與我們聯繫。或者,發送電子郵件至editorial-team@simplywallst.com。
譯文內容由第三人軟體翻譯。