
Teva Pharmaceutical Industries (NYSE:TEVA) Climbs 5.3% This Week, Taking Five-year Gains to 117%
Teva Pharmaceutical Industries (NYSE:TEVA) Climbs 5.3% This Week, Taking Five-year Gains to 117%
When you buy a stock there is always a possibility that it could drop 100%. But on the bright side, you can make far more than 100% on a really good stock. Long term Teva Pharmaceutical Industries Limited (NYSE:TEVA) shareholders would be well aware of this, since the stock is up 117% in five years. It's also good to see the share price up 26% over the last quarter. But this could be related to the strong market, which is up 13% in the last three months.
購買股票時總會有可能跌幅達100%以上。但美好的是,您在好股票上可以獲得比100%更高的收益。長揸梯瓦製藥(NYSE:TEVA)的股東應該已經知道這一點,因爲股票已經上漲了117%,達到5年。在過去的一個季度裏,股價上漲了26%,這也是一件好事。但這可能與市場強勁有關,過去三個月市場上漲了13%。
After a strong gain in the past week, it's worth seeing if longer term returns have been driven by improving fundamentals.
在過去的一週之內,獲得的強勁收益是否表明了長期回報受到基本面的推動值得關注。
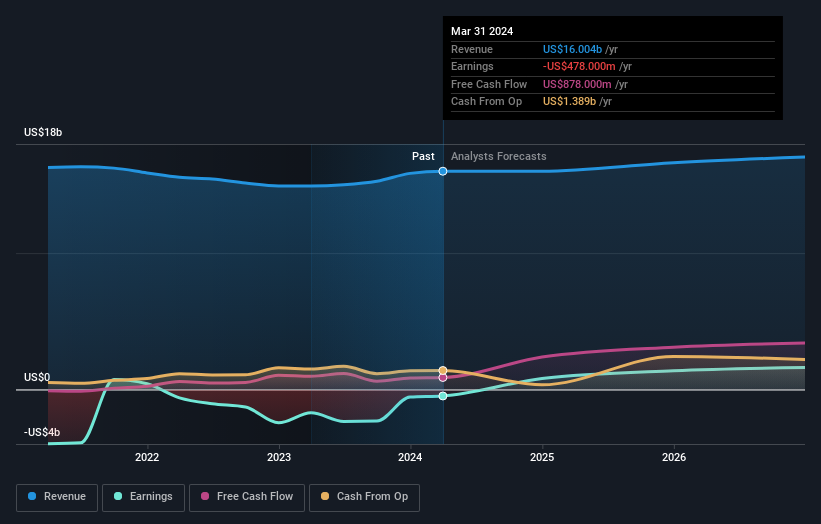
Teva Pharmaceutical Industries isn't currently profitable, so most analysts would look to revenue growth to get an idea of how fast the underlying business is growing. Generally speaking, companies without profits are expected to grow revenue every year, and at a good clip. As you can imagine, fast revenue growth, when maintained, often leads to fast profit growth.
梯瓦製藥目前沒有盈利,因此大多數分析師會查看營業收入增長情況,以了解基礎業務增長的速度。一般來說,沒有盈利的公司每年都有望增加營收,而且速度還不錯。可以想象,快速的營收增長如果持續下去,通常會導致快速的利潤增長。
In the last 5 years Teva Pharmaceutical Industries saw its revenue shrink by 2.5% per year. Given that scenario, we wouldn't have expected the share price to rise 17% per year, but that's what it did. It just goes to show tht the market is forward looking, and it's not always easy to predict the future based on past trends. Still, this situation makes us a little wary of the stock.
在過去的5年裏,梯瓦製藥的營業收入年均下降2.5%。在這種情況下,我們不會預期股價每年上漲17%,但事實確實如此。這只是表明市場是前瞻性的,並且僅依靠過去的趨勢並不總是容易預測未來。儘管如此,這種情況讓我們對該股持謹慎態度。
The graphic below depicts how earnings and revenue have changed over time (unveil the exact values by clicking on the image).
下面的圖表顯示了收益和營收隨時間的變化情況(通過單擊圖像揭示確切的值)。
Teva Pharmaceutical Industries is a well known stock, with plenty of analyst coverage, suggesting some visibility into future growth. Given we have quite a good number of analyst forecasts, it might be well worth checking out this free chart depicting consensus estimates.
梯瓦製藥是一支知名股票,受到許多分析師的關注,這表明市場對未來增長有一定的預期。由於我們有相當數量的分析師預測,因此檢查這個免費圖表描繪的共識估計可能非常值得。
A Different Perspective
不同的觀點
It's nice to see that Teva Pharmaceutical Industries shareholders have received a total shareholder return of 105% over the last year. Since the one-year TSR is better than the five-year TSR (the latter coming in at 17% per year), it would seem that the stock's performance has improved in recent times. In the best case scenario, this may hint at some real business momentum, implying that now could be a great time to delve deeper. Shareholders might want to examine this detailed historical graph of past earnings, revenue and cash flow.
很高興看到梯瓦製藥股東在過去一年中獲得了總股東回報率達105%。由於一年的TSR(股東回報率)優於五年的TSR(後者達到每年17%),因此似乎該股票的表現近期有所改善。在最好的情況下,這可能暗示了一些真正的業務勢頭,這意味着現在可能是深入研究的好時機。股東可能希望檢查過去收益,營業收入和現金流的詳細歷史圖表。
If you would prefer to check out another company -- one with potentially superior financials -- then do not miss this free list of companies that have proven they can grow earnings.
如果您願意查看另一家公司(具有潛在的更好財務狀況),請不要錯過這個免費的公司列表,證明它們可以增長收益。
Please note, the market returns quoted in this article reflect the market weighted average returns of stocks that currently trade on American exchanges.
請注意,本文所引述的市場回報反映了目前在美國交易所上市的股票的市場加權平均回報。
Have feedback on this article? Concerned about the content? Get in touch with us directly. Alternatively, email editorial-team (at) simplywallst.com.
This article by Simply Wall St is general in nature. We provide commentary based on historical data and analyst forecasts only using an unbiased methodology and our articles are not intended to be financial advice. It does not constitute a recommendation to buy or sell any stock, and does not take account of your objectives, or your financial situation. We aim to bring you long-term focused analysis driven by fundamental data. Note that our analysis may not factor in the latest price-sensitive company announcements or qualitative material. Simply Wall St has no position in any stocks mentioned.
對本文有任何反饋?對內容有任何疑慮?請直接與我們聯繫。或者,發送電子郵件至editorial-team@simplywallst.com。
這篇文章是Simply Wall St的一般性文章。我們根據歷史數據和分析師預測提供評論,只使用公正的方法論,我們的文章並不意味着提供任何金融建議。文章不構成買賣任何股票的建議,也不考慮您的目標或您的財務狀況。我們的目標是帶給您基本數據驅動的長期關注分析。請注意,我們的分析可能不考慮最新的價格敏感公司公告或定性材料。Simply Wall St沒有任何股票頭寸。
Have feedback on this article? Concerned about the content? Get in touch with us directly. Alternatively, email editorial-team@simplywallst.com
對本文有任何反饋?對內容有任何疑慮?請直接與我們聯繫。或者,發送電子郵件至editorial-team@simplywallst.com。
譯文內容由第三人軟體翻譯。