
Broadcom Gears Up For Stock Split With Clear Bullish Indicators
Broadcom Gears Up For Stock Split With Clear Bullish Indicators
Broadcom Inc. (NASDAQ:AVGO) is gearing up for its highly anticipated 10-for-1 stock split on July 12. Following in the footsteps of recent splits by Nvidia Corp (NASDAQ:NVDA) and Chipotle Mexican Grill (NYSE:CMG), Broadcom aims to make its soaring stock more accessible to a broader range of investors.
Broadcom公司(納斯達克股票代碼:AVGO)即將於7月12日進行備受期待的10比1股票分割。效仿Nvidia Corp(納斯達克股票代碼:NVDA)和Chipotle Mexican Grill(紐約證券交易所股票代碼:CMG)近期的股票分割,Broadcom旨在讓其股價飆升的股票更加容易被更廣泛的投資者獲取。
Currently trading over $1,700, the stock has surged approximately 500% over the past five years, thanks to increasing demand from artificial intelligence (AI) customers.
由於人工智能(AI)客戶的需求增加,現在的股票價格已經超過1700美元,過去5年中上漲了約500%。
In a strategic move to refinance a portion of the loans used for its $69 billion acquisition of VMware Inc., Broadcom recently issued $5 billion in bonds. This move highlights the company's strong financial standing and strategic planning.
爲了將貸款的一部分用於重新融資威睿公司(VMware Inc.)接收協議中的690億美元的收購款項,Broadcom最近發行了500億美元的債券。此舉凸顯了該公司強勁的財務狀況和戰略規劃。
Read Also: Broadcom Issues $5B in Debt To Fund VMware Acquisition
還讀:Broadcom 發行 50 億美元債券以爲威睿收購融資
Bullish Signals On The Horizon For Broadcom Stock
Broadcom 股票的積極信號正在向前方呼嘯而來
As the stock split approaches, Broadcom's technical indicators suggest a bullish trend.
隨着股票分割的臨近,Broadcom的技術指標表明看好的趨勢。
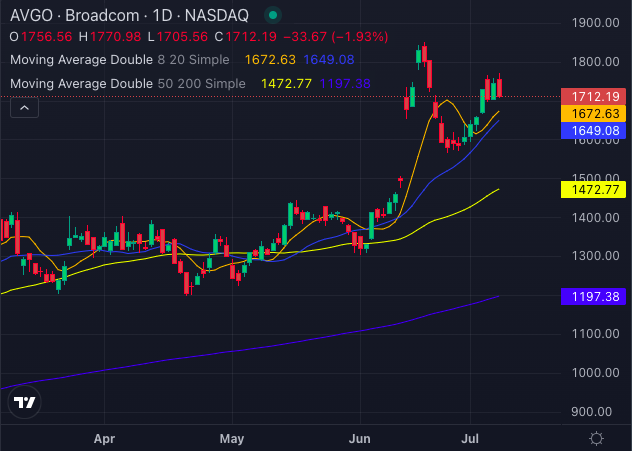
Chart created using Benzinga Pro
使用Benzinga Pro創建的圖表
The current share price of $1,712.19 is well above its 5-day, 20-day, and 50-day exponential moving averages, indicating strong buying pressure. The 8-day simple moving average (SMA) is at $1,672.63, while the 20-day SMA stands at $1,649.08, both reinforcing bullish signals with the current price above these levels.
目前的股票價格是1712.19美元,遠高於其5日、20日和50日的指數移動平均線,表明有強大的買入力量。8日的簡單移動平均線(SMA)爲1672.63美元,而20日的SMA則爲1649.08美元,均強化了積極信號,並且當前價格位於這些水平線以上。
Broadcom's 50-day SMA is $1,472.77, further validating the bullish sentiment as the current price remains significantly higher. The 200-day SMA is $1,197.38, indicating a long-term positive outlook with the stock price far exceeding this average.
Broadcom的50日指數移動平均線爲1472.77美元,進一步確認了看好的情緒,因爲當前的股價仍然高得多。200日指數移動平均線爲1197.38美元,表明長期的積極前景,股價遠遠超過這個平均水平。
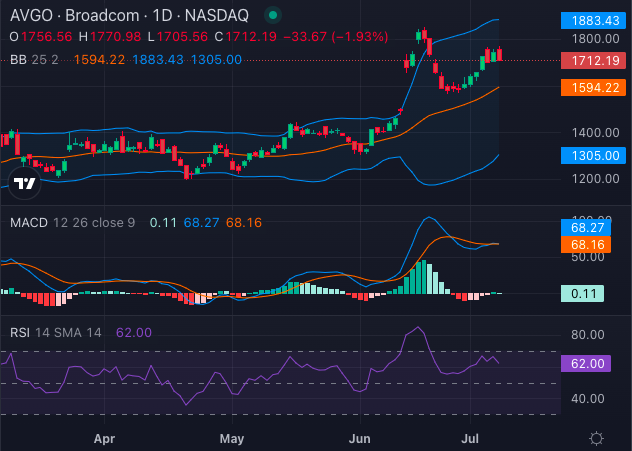
Chart created using Benzinga Pro
使用Benzinga Pro創建的圖表
The Moving Average Convergence Divergence (MACD) indicator is at 68.27, suggesting continued bullish momentum. Additionally, the Relative Strength Index (RSI) is 68.27, indicating that while the stock is almost overbought, it remains within a bullish range.
移動平均收斂背離指標(MACD)爲68.27,建議繼續看好動量。此外,相對強弱指數(RSI)爲68.27,表明股票幾乎已經超買,但仍在一個看好的範圍內。
Bollinger Bands analysis also supports a bullish sentiment, with the 25-day bands ranging from $1,305.00 to $1,883.43. The current price lies within the upper (bullish) bands, reinforcing the bullish outlook.
波動帶分析也支持看好情緒,25天的波動帶範圍爲1305.00美元至1883.43美元。當前價格位於上行(看好)波動帶內,進一步強化了看好的前景。
Broadcom's upcoming stock split, combined with solid technical indicators, positions the company for a potentially strong performance in the coming months. Investors are showing interest in the stock due to its accessibility and potential for future growth.
加上穩健的技術指標,Broadcom即將到來的股票分割使得該公司在未來幾個月內有實現強勁表現的潛力。投資者對該股票的興趣是由於其易於獲取性和未來增長的潛力。
- EXCLUSIVE: Tech Valuations 'Pricey', Cybersecurity 'Top Of Mind' Ahead Of US Elections
- 獨家報道:技術估值“過高”,網絡安全概念在美國大選前“備受關注”
Photo: Piotr Swat/Shutterstock.com
照片:Piotr Swat / shutterstock
譯文內容由第三人軟體翻譯。