
Does Olin (NYSE:OLN) Have A Healthy Balance Sheet?
Does Olin (NYSE:OLN) Have A Healthy Balance Sheet?
Some say volatility, rather than debt, is the best way to think about risk as an investor, but Warren Buffett famously said that 'Volatility is far from synonymous with risk.' So it seems the smart money knows that debt - which is usually involved in bankruptcies - is a very important factor, when you assess how risky a company is. We note that Olin Corporation (NYSE:OLN) does have debt on its balance sheet. But should shareholders be worried about its use of debt?
有人認爲,作爲投資者,應該根據風險思考波動性而非債務,但禾倫·巴菲特曾著名地說過:“波動性遠非風險的代名詞”。因此,聰明的投資者應該知道,債務通常與破產有關,是評估公司風險的非常重要的因素。我們注意到,歐林公司(NYSE:OLN)確實在其資產負債表中有債務。但是,股東應該擔心債務的使用嗎?
When Is Debt A Problem?
什麼時候負債才是一個問題?
Generally speaking, debt only becomes a real problem when a company can't easily pay it off, either by raising capital or with its own cash flow. Ultimately, if the company can't fulfill its legal obligations to repay debt, shareholders could walk away with nothing. However, a more frequent (but still costly) occurrence is where a company must issue shares at bargain-basement prices, permanently diluting shareholders, just to shore up its balance sheet. Having said that, the most common situation is where a company manages its debt reasonably well - and to its own advantage. When we think about a company's use of debt, we first look at cash and debt together.
一般而言,只有在一家公司無法輕鬆償還債務,或者無法以自身的現金流或籌資來償還債務時,債務才會成爲真正的問題。最終,如果公司無法履行其法定償還債務的義務,則股東可能什麼都得不到。但是,更頻繁(但仍然代價高昂)的情況是,公司必須以低廉的價格發行股票,永久性地稀釋股東權益,以支撐其資產負債表。話雖如此,最常見的情況是,公司合理地管理其債務並從中獲益。在考慮公司的債務使用時,我們首先看現金和債務的組合情況。
What Is Olin's Net Debt?
歐林的淨債務是多少?
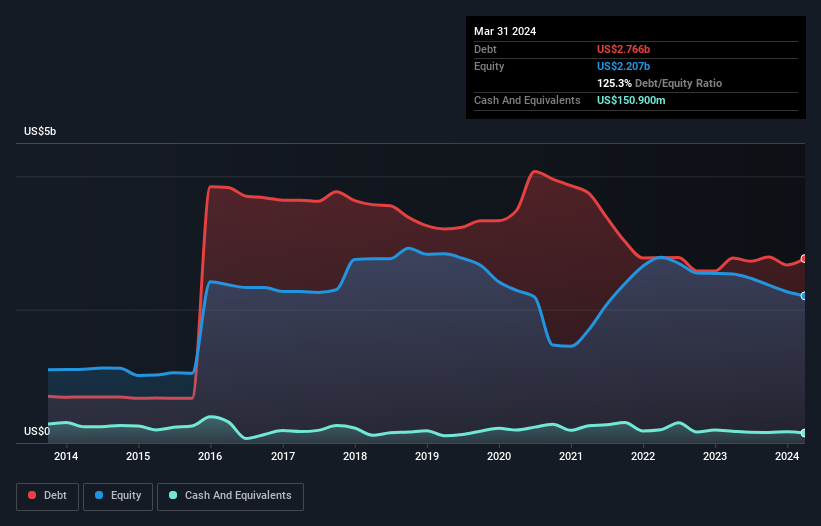
The chart below, which you can click on for greater detail, shows that Olin had US$2.77b in debt in March 2024; about the same as the year before. However, it does have US$150.9m in cash offsetting this, leading to net debt of about US$2.61b.
下面的圖表(您可以單擊它以獲得詳細信息)顯示,歐林在2024年3月擁有27.7億美元的債務;與去年大致相同。然而,它確實擁有1,509萬美元的現金,抵消了這一點,導致淨債務約爲26.1億美元。
How Strong Is Olin's Balance Sheet?
歐林的資產負債表有多強?
The latest balance sheet data shows that Olin had liabilities of US$1.42b due within a year, and liabilities of US$3.99b falling due after that. Offsetting this, it had US$150.9m in cash and US$922.8m in receivables that were due within 12 months. So its liabilities total US$4.33b more than the combination of its cash and short-term receivables.
最新的資產負債表數據顯示,歐林有14.2億美元的短期到期負債和39.9億美元的長期到期負債。抵銷這一點,它有1,509萬美元的現金和922.8萬美元的應收賬款,這些應收賬款在12個月內到期。因此,其負債總額比其現金和短期應收款項的總和高出43.3億美元。
This is a mountain of leverage relative to its market capitalization of US$5.46b. Should its lenders demand that it shore up the balance sheet, shareholders would likely face severe dilution.
這相對於其市值54.6億美元而言,是一個巨大的槓桿作用。如果其放貸人要求其支持資產負債表,股東可能面臨嚴重的稀釋。
We measure a company's debt load relative to its earnings power by looking at its net debt divided by its earnings before interest, tax, depreciation, and amortization (EBITDA) and by calculating how easily its earnings before interest and tax (EBIT) cover its interest expense (interest cover). This way, we consider both the absolute quantum of the debt, as well as the interest rates paid on it.
我們通過查看淨債務除以利息、稅、折舊和攤銷前的收益(EBITDA)並計算其利息費用(利息覆蓋)來相對衡量公司的負債水平。這樣,我們考慮債務的絕對規模以及支付的利息費用。
Olin's net debt is sitting at a very reasonable 2.3 times its EBITDA, while its EBIT covered its interest expense just 3.4 times last year. While that doesn't worry us too much, it does suggest the interest payments are somewhat of a burden. Shareholders should be aware that Olin's EBIT was down 61% last year. If that earnings trend continues then paying off its debt will be about as easy as herding cats on to a roller coaster. The balance sheet is clearly the area to focus on when you are analysing debt. But ultimately the future profitability of the business will decide if Olin can strengthen its balance sheet over time. So if you want to see what the professionals think, you might find this free report on analyst profit forecasts to be interesting.
歐林的淨債務非常合理,是其EBITDA的2.3倍,而去年其EBIT覆蓋其利息支出僅爲3.4倍。雖然這不太令人擔憂,但這表明利息支出有些是負擔。股東應該知道,歐林去年的EBIT下降了61%。如果這種盈利趨勢繼續下去,那麼償還其債務將像讓貓進入過山車一樣困難。分析債務時,資產負債表顯然是需要關注的區域。但最終,業務未來的盈利能力將決定歐林能否隨着時間推移加強其資產負債表。因此,如果您想了解專業人士的看法,您可能會發現這份免費的分析師盈利預測報告很有趣。
Finally, while the tax-man may adore accounting profits, lenders only accept cold hard cash. So we clearly need to look at whether that EBIT is leading to corresponding free cash flow. During the last three years, Olin generated free cash flow amounting to a very robust 86% of its EBIT, more than we'd expect. That puts it in a very strong position to pay down debt.
最後,雖然稅務部門可能非常欣賞會計利潤,但放貸人只接受冰冷的現金。因此,我們顯然需要查看那個EBIT是否導致相應的自由現金流。在過去的三年中,歐林產生了非常強大的86%的自由現金流,超過我們的預期。這使它處於非常強大的償還債務的位置。
Our View
我們的觀點
We'd go so far as to say Olin's EBIT growth rate was disappointing. But at least it's pretty decent at converting EBIT to free cash flow; that's encouraging. Once we consider all the factors above, together, it seems to us that Olin's debt is making it a bit risky. That's not necessarily a bad thing, but we'd generally feel more comfortable with less leverage. The balance sheet is clearly the area to focus on when you are analysing debt. But ultimately, every company can contain risks that exist outside of the balance sheet. Case in point: We've spotted 2 warning signs for Olin you should be aware of.
我們甚至可以說,歐林的EBIT增長率令人失望。但至少它在將EBIT轉換爲自由現金流方面非常不錯;這令人鼓舞。綜上考慮,我們認爲歐林的債務存在一定風險。這不一定是壞事,但我們通常會感覺到槓桿作用小一些會更舒適。資產負債表顯然是需要關注的區域。但最終,每家公司都可能存在超過資產負債表範圍的風險。例如:我們發現有2個歐林的警告信號,您應該知道。
When all is said and done, sometimes its easier to focus on companies that don't even need debt. Readers can access a list of growth stocks with zero net debt 100% free, right now.
說到底,有時更容易關注那些甚至不需要債務的公司。讀者可以免費查看零淨債務增長股票列表,立即獲得。
Have feedback on this article? Concerned about the content? Get in touch with us directly. Alternatively, email editorial-team (at) simplywallst.com.
This article by Simply Wall St is general in nature. We provide commentary based on historical data and analyst forecasts only using an unbiased methodology and our articles are not intended to be financial advice. It does not constitute a recommendation to buy or sell any stock, and does not take account of your objectives, or your financial situation. We aim to bring you long-term focused analysis driven by fundamental data. Note that our analysis may not factor in the latest price-sensitive company announcements or qualitative material. Simply Wall St has no position in any stocks mentioned.
對本文有反饋?關於內容有所顧慮?直接和我們聯繫。或者,發送電子郵件至editorial-team (at) simplywallst.com。
這篇文章是Simply Wall St的一般性文章。我們根據歷史數據和分析師預測提供評論,只使用公正的方法論,我們的文章並不意味着提供任何金融建議。文章不構成買賣任何股票的建議,也不考慮您的目標或您的財務狀況。我們的目標是帶給您基本數據驅動的長期關注分析。請注意,我們的分析可能不考慮最新的價格敏感公司公告或定性材料。Simply Wall St沒有任何股票頭寸。
Have feedback on this article? Concerned about the content? Get in touch with us directly. Alternatively, email editorial-team@simplywallst.com
對本文有反饋?關於內容有所顧慮?直接和我們聯繫。或者發送電子郵件至editorial-team@simplywallst.com。
譯文內容由第三人軟體翻譯。