
Could The Market Be Wrong About W.W. Grainger, Inc. (NYSE:GWW) Given Its Attractive Financial Prospects?
Could The Market Be Wrong About W.W. Grainger, Inc. (NYSE:GWW) Given Its Attractive Financial Prospects?
It is hard to get excited after looking at W.W. Grainger's (NYSE:GWW) recent performance, when its stock has declined 10% over the past three months. But if you pay close attention, you might gather that its strong financials could mean that the stock could potentially see an increase in value in the long-term, given how markets usually reward companies with good financial health. In this article, we decided to focus on W.W. Grainger's ROE.
美國固安捷(NYSE:GWW)的股票在過去三個月下跌了10%,因此很難對其近期表現感到興奮。但是如果你密切關注,你可能會認爲,考慮到市場通常獎勵具有良好財務狀況的公司,其強勁的財務狀況可能意味着該股票在長期內有可能看到增值。在本文中,我們決定專注於美國固安捷的roe。
Return on Equity or ROE is a test of how effectively a company is growing its value and managing investors' money. Put another way, it reveals the company's success at turning shareholder investments into profits.
ROE,即淨資產收益率,測試一家公司有效增加價值和管理股東資金的能力。換句話說,它揭示了公司將股東投資轉化爲利潤的成功程度。
How To Calculate Return On Equity?
如何計算股東權益報酬率?
Return on equity can be calculated by using the formula:
股東權益報酬率可以使用以下公式計算:
Return on Equity = Net Profit (from continuing operations) ÷ Shareholders' Equity
淨資產收益率 = 淨利潤(從持續經營中獲得)÷ 股東權益
So, based on the above formula, the ROE for W.W. Grainger is:
所以,根據上述公式,美國固安捷的ROE爲:
54% = US$1.9b ÷ US$3.5b (Based on the trailing twelve months to March 2024).
54% = US$19億 ÷ US$35億(基於最近12個月至2024年3月)。
The 'return' is the yearly profit. One way to conceptualize this is that for each $1 of shareholders' capital it has, the company made $0.54 in profit.
'回報率'是每年的利潤。一個理解這個的方法是,對於每一美元的股東資本,公司獲得0.54美元的利潤。
What Has ROE Got To Do With Earnings Growth?
ROE與盈利增長有什麼關係?
So far, we've learned that ROE is a measure of a company's profitability. Depending on how much of these profits the company reinvests or "retains", and how effectively it does so, we are then able to assess a company's earnings growth potential. Assuming all else is equal, companies that have both a higher return on equity and higher profit retention are usually the ones that have a higher growth rate when compared to companies that don't have the same features.
到目前爲止,我們已經了解到 ROE 是衡量公司盈利能力的指標。根據公司再投資或“保留”的這些利潤的數量以及其有效性,我們可以評估公司的盈利增長潛力。假設其他都相同,ROE 和利潤保留較高的公司通常具有更高的增長率,與那些沒有這些特點的公司相比。
A Side By Side comparison of W.W. Grainger's Earnings Growth And 54% ROE
W.W. Grainger盈利增長和54% ROE的並排比較
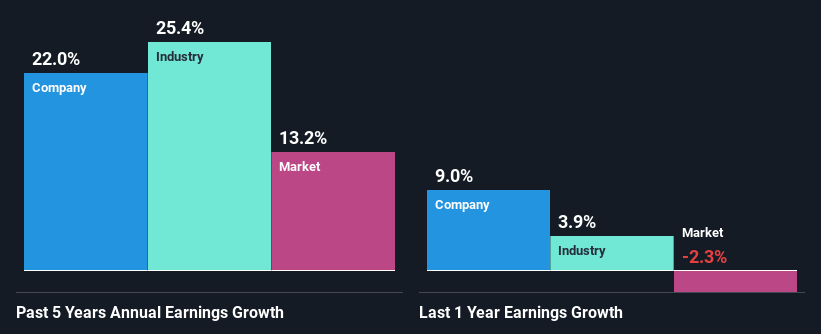
To begin with, W.W. Grainger has a pretty high ROE which is interesting. Additionally, the company's ROE is higher compared to the industry average of 17% which is quite remarkable. As a result, W.W. Grainger's exceptional 22% net income growth seen over the past five years, doesn't come as a surprise.
首先,W.W. Grainger的ROE相當高,這很有趣。此外,該公司的ROE高於行業平均水平17%,這相當引人注目。因此,過去五年W.W. Grainger異常的22%淨收入增長並不令人驚訝。
We then performed a comparison between W.W. Grainger's net income growth with the industry, which revealed that the company's growth is similar to the average industry growth of 25% in the same 5-year period.
然後我們對比了W.W. Grainger與行業的淨收入增長,發現該公司在同一5年期間的增長與平均行業增長率25%相似。
Earnings growth is an important metric to consider when valuing a stock. It's important for an investor to know whether the market has priced in the company's expected earnings growth (or decline). By doing so, they will have an idea if the stock is headed into clear blue waters or if swampy waters await. One good indicator of expected earnings growth is the P/E ratio which determines the price the market is willing to pay for a stock based on its earnings prospects. So, you may want to check if W.W. Grainger is trading on a high P/E or a low P/E, relative to its industry.
盈利增長是估值股票時需要考慮的重要指標。投資者了解市場是否已經將公司預期的盈利增長(或下降)定價非常重要。通過這樣做,他們將了解股票是否進入了清晰的藍色水域或是否等待沼澤水域。一個很好的預期盈利增長的指標是市盈率,它根據股票的盈利前景確定市場願意支付的價格。因此,你可能想檢查美國固安捷的PE是否高於或低於其行業水平。
Is W.W. Grainger Using Its Retained Earnings Effectively?
美國固安捷是否有效利用了其未分配利潤?
W.W. Grainger's ' three-year median payout ratio is on the lower side at 24% implying that it is retaining a higher percentage (76%) of its profits. So it looks like W.W. Grainger is reinvesting profits heavily to grow its business, which shows in its earnings growth.
美國固安捷的三年中位數股息支付率較低,爲24%,意味着其留存了更高比例(76%)的利潤。因此,看起來美國固安捷正在以高利潤增長率重投利潤來發展業務。
Additionally, W.W. Grainger has paid dividends over a period of at least ten years which means that the company is pretty serious about sharing its profits with shareholders. Upon studying the latest analysts' consensus data, we found that the company is expected to keep paying out approximately 21% of its profits over the next three years.
此外,美國固安捷已經連續支付超過十年的股息,這意味着該公司非常重視與股東分享其利潤。在研究最新的分析師共識數據時,我們發現該公司預計在未來三年內將繼續支付其利潤的約21%。
Conclusion
結論
Overall, we are quite pleased with W.W. Grainger's performance. Particularly, we like that the company is reinvesting heavily into its business, and at a high rate of return. Unsurprisingly, this has led to an impressive earnings growth. That being so, a study of the latest analyst forecasts show that the company is expected to see a slowdown in its future earnings growth. To know more about the company's future earnings growth forecasts take a look at this free report on analyst forecasts for the company to find out more.
總的來說,我們對美國固安捷的表現非常滿意。特別是,我們喜歡公司大量地、高收益地重投業務。毫不奇怪,這導致了顯著的盈利增長。然而,一項對最新分析師預測的研究表明,該公司未來盈利增長將放緩。
Have feedback on this article? Concerned about the content? Get in touch with us directly. Alternatively, email editorial-team (at) simplywallst.com.
This article by Simply Wall St is general in nature. We provide commentary based on historical data and analyst forecasts only using an unbiased methodology and our articles are not intended to be financial advice. It does not constitute a recommendation to buy or sell any stock, and does not take account of your objectives, or your financial situation. We aim to bring you long-term focused analysis driven by fundamental data. Note that our analysis may not factor in the latest price-sensitive company announcements or qualitative material. Simply Wall St has no position in any stocks mentioned.
對本文有反饋?關於內容有所顧慮?直接和我們聯繫。或者,發送電子郵件至editorial-team (at) simplywallst.com。
這篇文章是Simply Wall St的一般性文章。我們根據歷史數據和分析師預測提供評論,只使用公正的方法論,我們的文章並不意味着提供任何金融建議。文章不構成買賣任何股票的建議,也不考慮您的目標或您的財務狀況。我們的目標是帶給您基本數據驅動的長期關注分析。請注意,我們的分析可能不考慮最新的價格敏感公司公告或定性材料。Simply Wall St沒有任何股票頭寸。
Have feedback on this article? Concerned about the content? Get in touch with us directly. Alternatively, email editorial-team@simplywallst.com
對本文有反饋?關於內容有所顧慮?直接和我們聯繫。或者發送電子郵件至editorial-team@simplywallst.com。
譯文內容由第三人軟體翻譯。